| Home Prev | Next |
The InControl server maintains its own internal file system for storing various InControl objects. The Library Browser provides a means to view and manage these objects. Stored objects might be a dashboard, log explorer query or log analyzer query. The browser also provides an alternative way to open any of these objects without needing to first open the relevant tab.
The library browser is opened by pressing its button in the Home toolbar ribbon.

This opens the browser tab and on the left-hand side is navigation tree for the contents of the library.
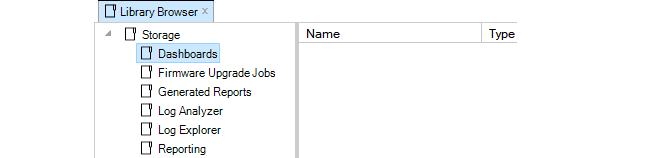
The top level navigation tree folders show the types of objects that can be stored in the server database library. Objects can be stored directly under their respective folders and can be further subdivided into subfolders
The library types are as follows:
Dashboards
These are saved dashboard queries which are described fully in Chapter 22, Firewall Monitoring. These same saved dashboards are also accessible by pressing the lower half of the Monitoring Dashboards button in the Home toolbar ribbon.
Firmware Upgrade Jobs
These are pending cOS Core upgrade jobs which also appear in the Firmware Upgrade Jobs tab. These are fully described in Chapter 12, Upgrading Devices.
Generated Reports
This folder contains generated reports that have been saved, in PDF format. Report generation is described fully in Section 23.8, InControl Reporting.
Log Analyzer
These are saved statistics log analyzer queries. These are fully described in Section 23.7, The Log Analyzer. These saved queries are also accessible through the sub menu shown by pressing the Open button in the Log Analyzer toolbar ribbon.
Log Explorer
These are saved queries from the Log Explorer which are described fully in Section 23.4, The Log Explorer. These saved queries are also accessible through the submenu shown by pressing the Open button in the Log Explorer toolbar ribbon.
Reports
This folder contains the saved definitions for reports. Saving report definitions is described fully in Section 23.8, InControl Reporting. All saved reports can also be viewed in the tab which is opened by pressing the Reports button in the Home toolbar ribbon.
For example, a dashboard may have been created and saved with the name My_GW_Dashboard. If the Dashboards entry in the navigation tree is selected, the dashboard appears in the table display of available dashboards.

If the dashboard is selected, information about the dashboard appears at the bottom of the library tab.

Activating a library object is done by double clicking it. If the dashboard in the example above is now double clicked, it will be activated and the "live" dashboard will appear in a Monitor Mode tab.

Object Options
Right-clicking a library item will bring up a context menu with options to cut, paste, delete and edit the item plus the ability to create a subfolder.
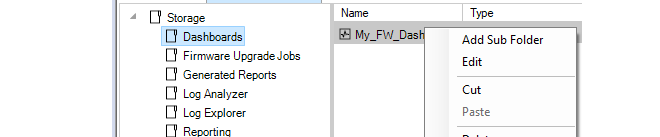
These same functions are also provided in the toolbar.

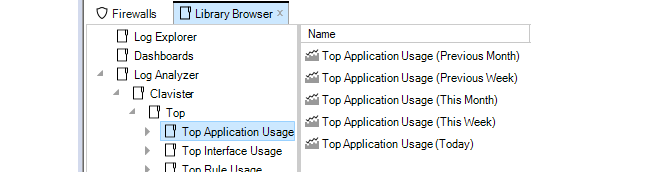
The New Folder option is used to create subfolders in the library. These provide a way up dividing up large numbers of objects into more manageable groups. There are no restrictions on the depth of nested folders. An example of subfolder usage with Log Analyzer is shown below.
Editing Properties
Choosing the Edit option will display a dialog that allows the properties of the library object to be changed.
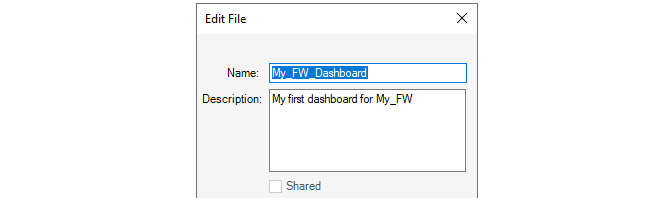
The Shared option in the Edit dialog is enabled by default. This means that the library object is visible to any other client accessing the InControl server database and also that it can be edited by any other client.
If the Shared option is disabled then that object can be seen only by the InControl user that saved the object. It will not be visible to any other user.