| Home Prev | Next |
For individual firewalls there are two types of monitoring available:
Real-Time Dashboard Monitoring
This provides the administrator with a tool to construct custom dashboards that provide real-time information on the traffic activity for one or many firewalls. This is described in Section 22.1, Dashboard Monitoring.
Rule Monitoring
This provides information about IP rule set activity for a specific cOS Core firewall. It is described in Section 22.2, Rules Monitoring.
Dashboard Monitoring provides a way to set up dashboards for one of more firewalls to see activity in real-time. It is opened by selecting the Dashboard Monitoring function in the Home ribbon.

Dashboard Monitoring Overview
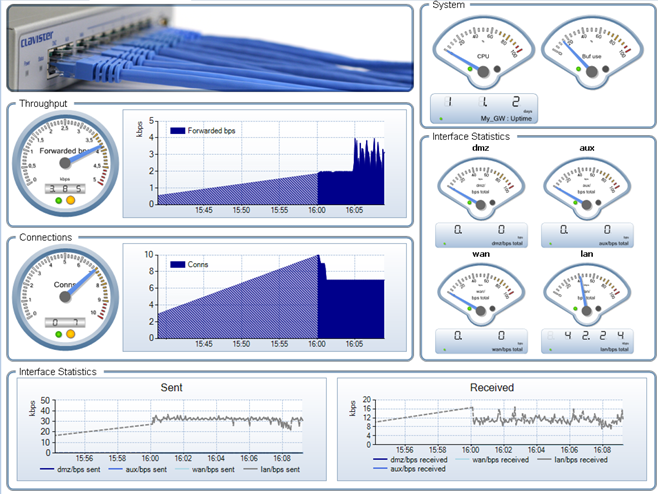
InControl Real-time Dashboard Monitoring allows monitoring of one or more Clavister firewalls using a variety of controls arranged in the style of a Dashboard. Two examples of typical dashboards are shown below to illustrate what is possible with this feature.
The image above illustrates a dashboard consisting of Gauge monitoring controls in various styles. Each Gauge is monitoring a single parameter in a cOS Core installation.
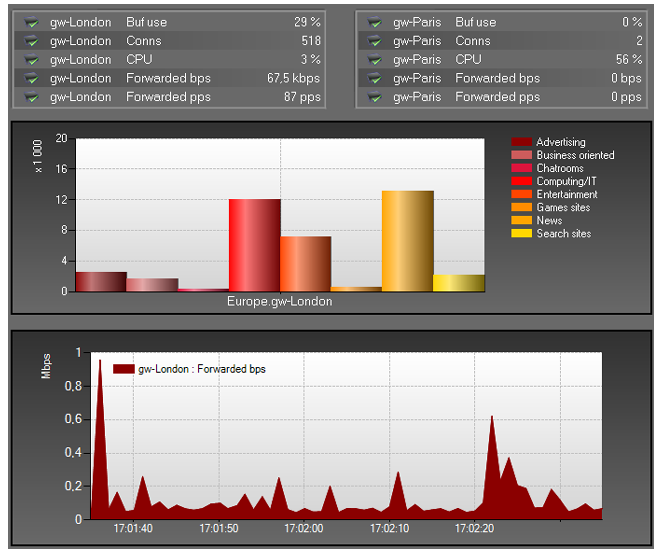
The image below shows a dashboard consisting of a List control at the top, a Bar Chart in the middle, with a Line Chart control at the bottom. The List and Chart are each being used to monitor a number of different parameters in a cOS Core installation at the same time.
Real-time Monitoring Components
When using Real-time Monitoring, the essential components are:Monitoring Controls
Monitoring Controls are graphical displays which can show the current value of a cOS Core operating parameter for a firewall. Some controls monitor only one parameter (Gauge), some can monitor multiple parameters (Chart or List). A range of control styles are available and almost any style can be associated with any cOS Core parameter.
Dashboards
A Dashboard is a set of one of more controls that are displayed together for monitoring a group of cOS Core parameters. Different controls in a single dashboard can monitor just one or many firewalls. monitoring controls of any type can be placed anywhere on a dashboard and they can be scaled to any size.
Monitoring Control Types
The following types of monitoring controls are available:Design Mode and Monitor Mode
Real-time Monitoring functions in one of two modes:![[Tip]](images/tip.png) |
Tip |
|---|---|
| Toggling between the design and monitor modes can be done with the F5 function key. |
Starting a New Dashboard
To begin a new dashboard, press the upper part of the Monitoring button in the Home tab.

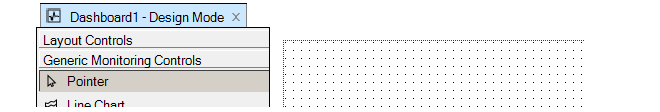
This opens a new Design Mode tab with the default name Dashboard1 and a blank dashboard.
Changing the Dashboard Visual Theme
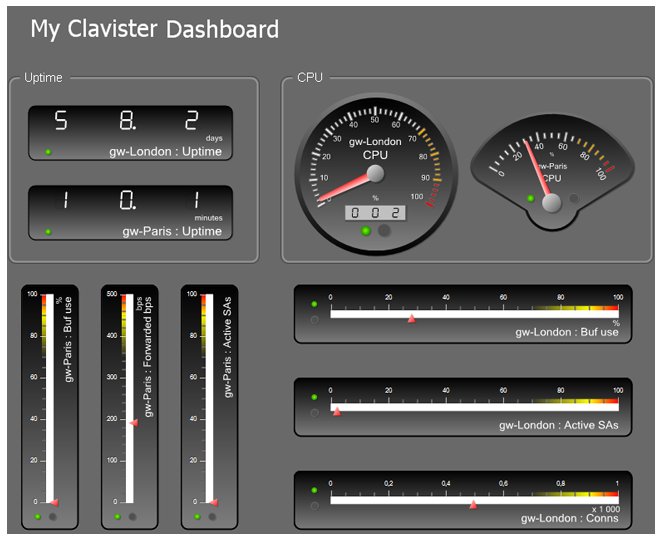
When just the dashboard background is selected (and this is the case when a new dashboard is created), there are Appearance settings for the entire dashboard displayed in the left-hand panel (an example is shown below). The Theme option can be used to change from the default white theme to a darker theme called Graphite (this is the theme used for the example dashboard shown at the beginning of this chapter).

Disabling the option DoubleBuffering can increase drawing performance but result in loss of smoothness. The option AutoScaleMode will change the drawing area to fit the controls added. The "Design" settings are for internal use only and need not be changed.
InControl provides a range of Monitoring Controls in different styles which are listed in a menu on the left of the design tab.
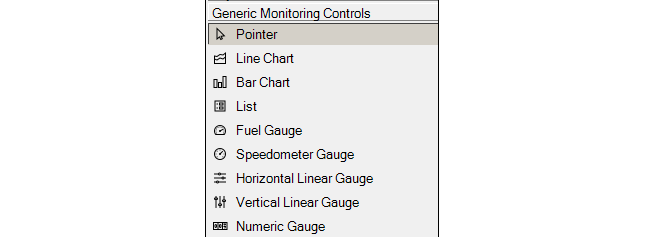
It is up to the administrator to decide the style that best suits the presentation needs for the value to be monitored. If it is preferable to have a single control monitor more than one parameter, a Bar Chart, Line Chart or List control could be used.
The Speedometer Gauge has been selected above. That control will now appear in an area dragged out with the mouse in the cross-hatched design space. Alternatively, it is possible to drag the control from the control menu directly into the design space, in which case a default size is used.

All monitoring control styles can be scaled further, smaller or larger, by dragging their edges at the marked points while their positions can be changed by dragging their borders.
New Controls are Not Connected
The text "Not Connected" appears in a new control to indicate that a firewall and the cOS Core parameter it will monitor on that firewall have not yet been selected for the control. Binding a control to a firewall parameter is described later in the section. Once selected, any of the Properties of this control can be set using the properties display which is shown below:
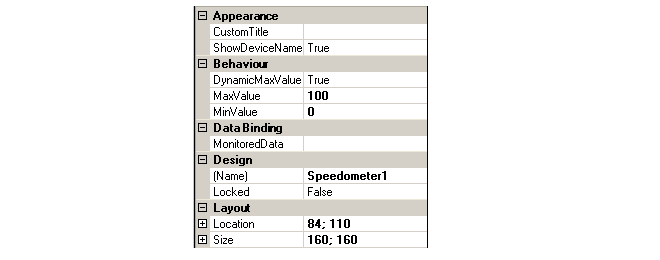
For each control, both the lower and maximum value of the monitored quantity can be specified. For some controls that can monitor several parameters, such as a Bar Chart or List, several parameters can be defined and the parameters can be for different firewalls.
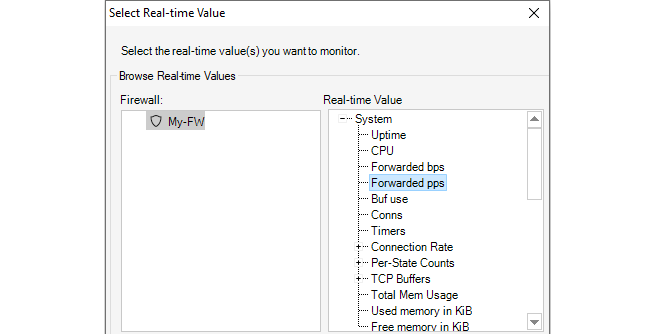
Sometimes it can be difficult to predict the maximum value of a parameter and if this is the case then the Dynamic Maximum Value can be set to True. This will mean that the control will extend its range and repaint itself automatically if the upper limit is exceeded (conversely it will reduce its range if the value falls back below the upper limit). One of the properties that must be set for a control to perform monitoring is the Data Binding. This is the combination of a firewall plus the cOS Core parameter within that firewall that is to be monitored.Selecting the Data Binding property will cause the dialog shown below to appear. On the left of the dialog are the firewalls which have been located automatically by InControl, on the right are the individual cOS Core parameters which can be monitored in each firewall.
Once the control is associated with a parameter, the parameter's name will appear on the control, as shown below.

![[Note]](images/note.png) |
Note: Controls without a binding do nothing |
|---|---|
|
If a control is not associated with a cOS Core parameter, it will still appear in a dashboard but will not do anything in monitor mode. |
Changing Design Mode to Monitor Mode
In order to have a new dashboard become "live" and start monitoring a firewall, it is necessary to switch from Design Mode to Monitor Mode. This is done by pressing the Run button.

As soon as monitor mode is active, the currently displayed dashboard will appear as a live display and begin showing live values retrieved from a firewall.

When the Stop button is pushed, the dashboard returns to design mode.

|
Tip |
|---|---|
|
Toggling between design and monitor modes can be done by pressing the F5 function key. |

The dashboard is given a user defined name and saved. Dashboards are not saved as normal files in the local file system. Instead, they are saved as an entry in the main InControl server database.
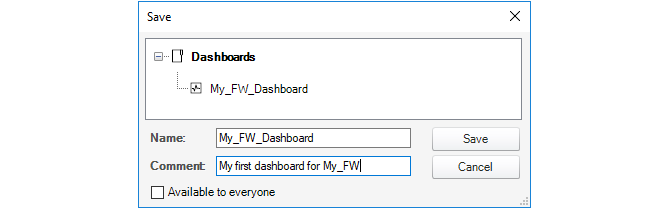
A checkbox at the bottom of the save dialog determines if the dashboard is available to all clients.
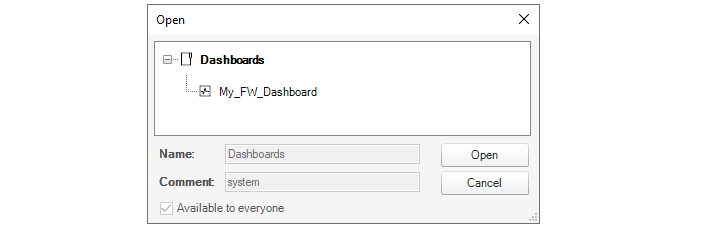
Once saved, the dashboard can be opened at any time by using the shortcut Ctrl-O to open the dashboard selection dialog.
Managing Dashboards with the Library Browser
All dashboards are saved in the library of the InControl server database. This library also contains other saved objects such as ILA database queries. The Library Browser is a generalized feature for managing any of these saved objects, allowing them to be renamed, deleted, grouped into subfolders and activated.For example, the dashboard called My_GW_Dashboard would appear in the library browser as shown below. Double clicking will activate it and a Monitor Mode tab will appear containing the dashboard.

The library browser is fully described in Chapter 24, The Library Browser.
Activating from the Dashboard Button
As an alternative to activating a saved dashboard through the library browser, if a firewall is selected in the Firewalls tab, pressing the lower part of the Dashboard Monitoring button in the Home toolbar brings up a list of available saved dashboards.In the example below, the dashboard called My_GW_Dashboard is available for selection.

Using Quick Monitor
InControl provides a single predefined dashboard that can be displayed using the Quick Monitor button in the Firewalls toolbar.

Below is an example of how this default dashboard looks.