| Home Prev | Next |
The InControl Reporting subsystem allows the generation of cOS Core log event analysis reports as a file in either HTML or PDF format.
When creating a report file definition, one or more sections are added to the definition. Each section contains one of the Log Analyzer predefined queries or a custom query (see Section 23.7, The Log Analyzer). A query can appear in graphical and/or table format and further refinements can also be made to the query.
The following are some key points about the generation of these reports:
The reports are initiated by the client but it is the InControl server that performs the generation of these reports.
After initiating report generation, the client does not have to wait for the report to be finished. A progress bar at the bottom of the client interface indicates the report generation progress and the client can continue to be used for other tasks.
Multiple reports can be in the process of generation at the same time on the server and each will have its own progress bar at the bottom of the client interface.
The user can close the InControl client and this will have no effect on any ongoing report generation.
When a report finishes generation, it becomes part of the Report Archive on the server. This archive can be managed by the InControl client and completed reports can be opened and saved to the local disk.
Prerequisites for Creating Report Files
Before a report can be created, the following prerequisites need to be met:At least one firewall needs to be configured to send its log messages to an InControl Logging Agent.
The Data Cubes option needs to be enabled for the receiving logging agent. This is done with the following steps:
Select Logging Agents to see all configured agents.
Select the target logging agent from the list.
Select Configure.
Select Analysis.
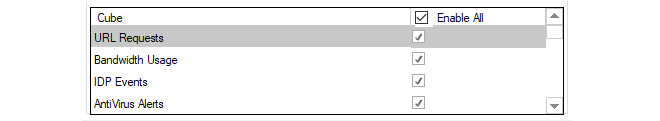
Select the Enable All option in the Cube list, as shown below.
Listing Existing Reports
To list all the existing reports, select the Home toolbar ribbon and then select the Reporting icon to open the Reporting tab.

The first time the reporting tab is presented, it displays a list of predefined reports as shown below.
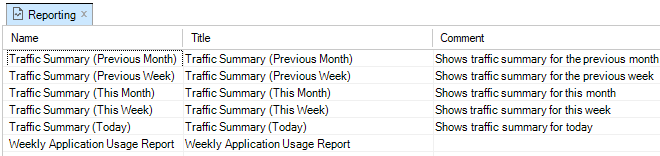
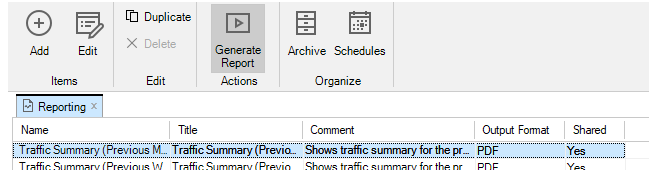
Any of the reports in this list can be generated by selecting the individual report and then selecting the Generate Report option in the toolbar ribbon.
The InControl server will now start to generate the report in the background and a progress bar, like the one below, will appear at the bottom of the client interface to indicate the report's progress. The client can be used for other tasks while the report is generated by the server in the background.

Multiple reports can be requested and can be generated on the InControl server at the same time. A separate progress bar will appear at the bottom of the client interface for each report. Even if the client is closed, report generation will continue. When a report is complete, it is saved on the server in the Report Archive and this archive can be managed by pressing the Archive button in the toolbar so that the Report Archive tab opens in the client as shown below.
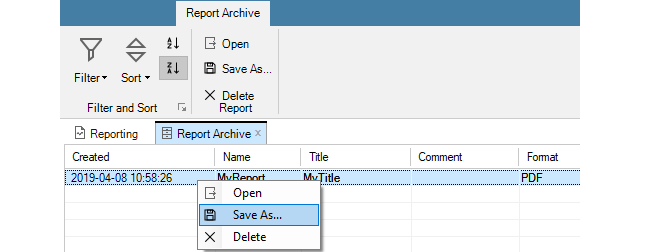
Using the Report Archive tab, the finished reports on the server can be managed and also saved to the local disk using the Save as.. option.
It can be desirable to anonymize a report when it is generated. This means that references to potentially sensitive information is automatically replaced with anonymous naming, such as IP.1, IP.2 and IP.3 instead of the actual IP addresses. This is done by choosing the anonymize option from the run report button, as shown below.

Other information apart from IP addresses that will be automatically anonymized includes usernames, email addresses, MAC addresses and URLs. Anonymizing scheduled reports can be specified by ticking a checkbox in the new schedule dialog, as explained in Section 23.9, Report Schedules.
To create a new report, select Add and the following new report dialog will appear.
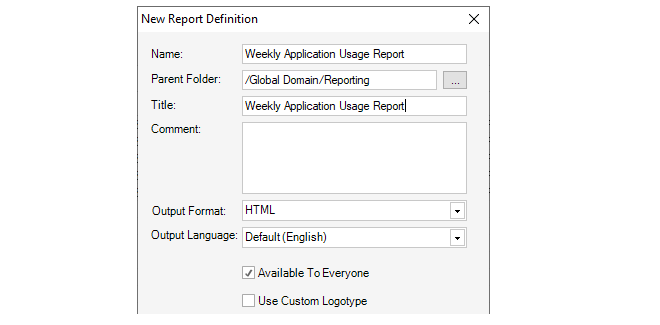
The fields in this dialog are the following:
Report Name - The logical name for this report in InControl.
Parent Folder - The folder where the report is created. The default folder is Reporting. If the file chooser is selected, this will provide a view of the only InControl folders available for saving.
Report Title - The title of the report which is shown on the report's first page.
Comment - An optional note for the administrator to describe the report in more detail.
Output Format - Either PDF or HTML.
Output Language - The language to be used for report annotation.
Available to everyone - Determines if this object will be a shareable library object. See Chapter 24, The Library Browser for more about sharing library objects.
Use Custom Logotype - If this option is selected, the dialog will be extended so that a custom image can be selected. This is shown in the example screenshot below.
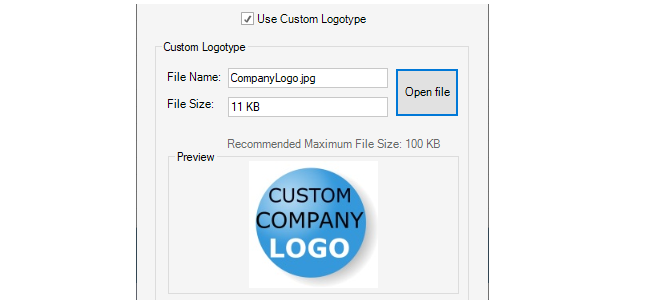
Either a JPG or PNG image file with a maximum file size of one megabyte can be selected for the logotype. There is no restriction on image dimensions, however, an extra-wide image will be scaled down to fit the report width. The example image selection shown above will result in the report heading format shown below.
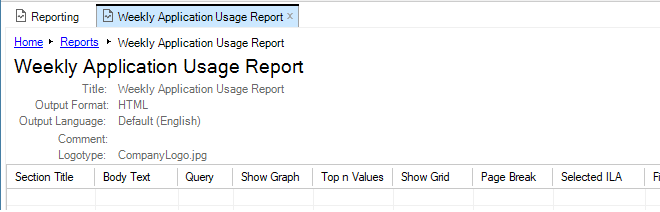
Pressing OK in the new report dialog will save the report to the report list along with the predefined reports. There is a column in the report list with the heading Logotype which contains the name of any logotype image file assigned to a report.
A new report is initially empty of data and needs to have one or more sections added to it before it has any meaning. Adding report sections is described next.
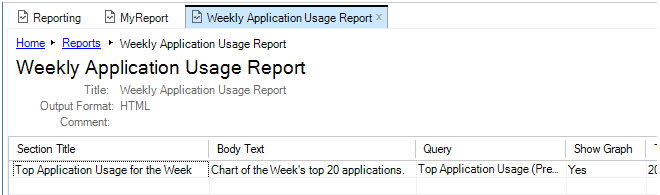
To add or edit the contents of a report, select the report from the report list. This will open a new tab for the individual report in the InControl client interface, as shown in the screenshot below.
To add a new section to the report, select Add. This will open the following dialog.
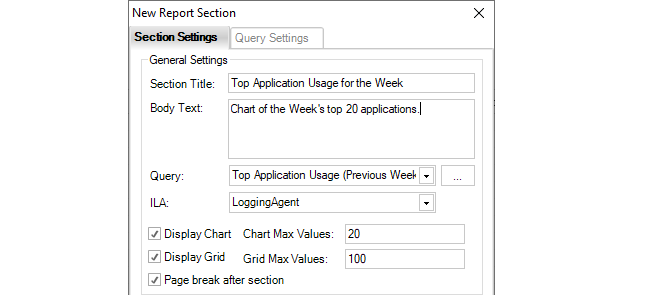
The individual fields in this dialog are as follows:
Section title - The title of the section which will appear at the head of the section in bold.
Body text - A short description which will appear in the report after the section title.
Query - Select the log analyzer query. This can be one of the predefined queries or a user defined query.
ILA - The logging agent which is receiving the logs being analyzed.
Display chart - Enable this option if the query data is to be presented as a chart.
Chart max values - Limits the number of values in the chart. Too many values makes it hard to read.
Display grid - Enable this option if the query data is to be shown as a table.
Grid max values - Limits the number of rows displayed in the table.
Page break after section - Enable this to insert a page break after a section in the PDF.
The same dialog also includes fields which allow the size and image types of a chart to be changed. The default chart values are shown below.

When all the values in the dialog are satisfactory, select OK to save the section so it becomes part of the report.
When the report has all its sections added, it can be generated just like a predefined report by selecting Generate Report, as described earlier.
The above dialog has a tab called Query Settings. Using this is optional. It allows the query to be refined further so it only applies to traffic that meets specific criteria, such as a specific cOS Core source interface. If the report was only going to apply to the G2 interface of the firewall then the settings would be as shown below.
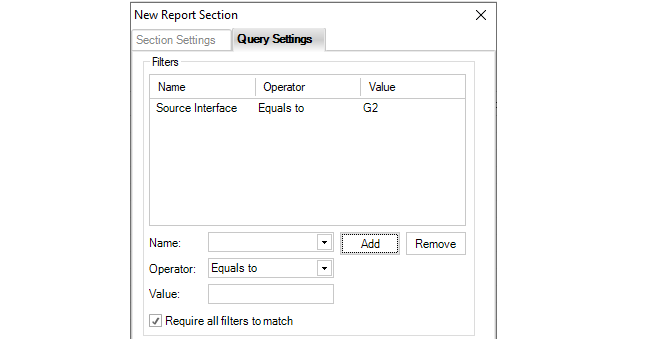
Several filters can be added and if the setting "Require all filters to match" is enabled all conditions filters must trigger for the data to be included in the report. If this option is not enabled then only any one filter needs to match.
The Query Settings tab also allows adjustment to the time criteria of the report. The options are available through a dropdown menu as shown below:

The default is relative time.

Alternatively, a specific time interval can be specified.

![[Note]](images/note.png)