| Home Prev | Next |
The Log Analyzer is a feature that provides further analysis capabilities for looking at log events generated by cOS Core and collected by an ILA instance. However, instead of analyzing the ILA log data files directly, the analyzer uses its own special Log Analyzer Database. This special analyzer database is separate from the raw log message database which is created by the ILA log receiver (described in Section 23.2, The InControl Logging Agent (ILA)).
This log analyzer database is different in that it does not collect individual raw log events. Instead, it takes the raw log message database as input and collects statistics for the occurrence of particular event types. For example, the opening of new connections. The log analyzer database only starts to be built when the collection of all or specific statistics are enabled for individual firewalls. By default, the database software used for the log analyzer database is SQLite™ but, as discussed at the end of this section, the administrator can configure InControl to build the database using alternative software.
The log analyzer database is not built in real-time like the standard ILA log data files. A low priority background process reads the raw log data files created by the ILA log receiver and adds information from new log message data to the analyzer database. There can therefore exist a brief lag between the two sets of data becoming synchronized. The reason for using a second way of storing data for the analyzer is that the log analyzer database structures the information in such a way that allows complicated reports to be generated much more easily.
Note that the Log Analyzer does not use LQL as an intermediate stage for query processing. LQL is only relevant to the Log Explorer feature.
![[Note]](images/note.png) |
Note: A Summary of the Log Analyzer |
|---|---|
|
It is important to remember the following about the log analyzer:
|
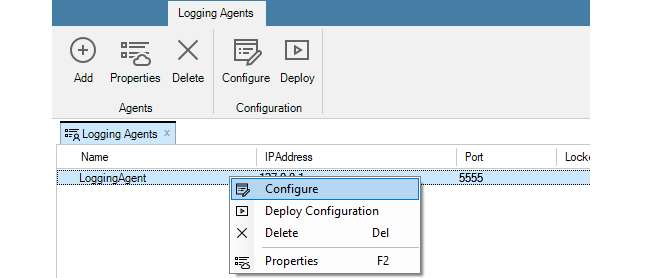
Enabling the Log Analyzer Feature
Enabling the log analyzer feature for a firewall is done with the following steps:
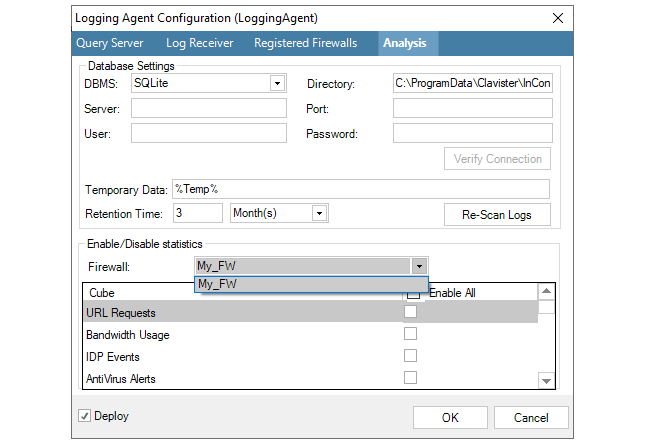
Now, choose the statistics that are to be collected for this firewall. These are referred to as the type of Cube since the collected data will have more than two dimensions.
For example, in the screenshot below, Connection Statistics and User Auth Events will be analyzed later.
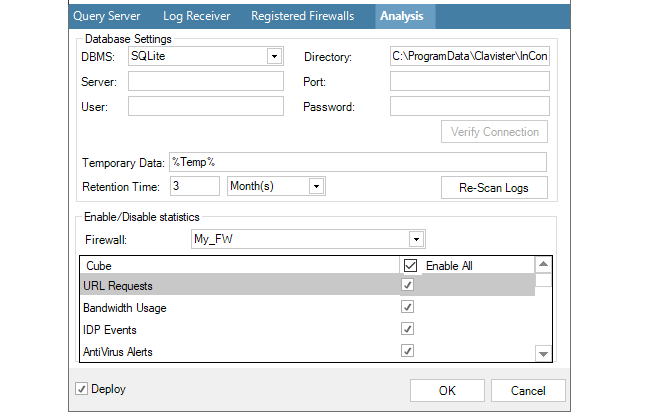
This process is then repeated for any other firewalls for which statistics are to be saved. Any number of statistics can be saved for any firewall. The database size can become large over an extended period of time and it therefore recommended to limit statistics collection to the least acceptable number of statistics for the least acceptable number of firewalls.
Press OK to commit the logging agent configuration changes. The configured statistics will now begin to be saved by the ILA server for analysis by the Log Analyzer feature.
If later, the reverse process is followed so that a selected statistic becomes deselected for a firewall, then that statistic will be removed from the log analyzer database. However, removal does not happen immediately. Instead, this is done during the scheduled maintenance period for the ILA which is specified in the Log Receiver tab.
Once the log analyzer database is being constructed for a particular firewall, the log analyzer query functions can be used to generate reports from that database.
The report generator for the analyzer is started by first pressing the top part of the Log Analyzer button in the Home toolbar.

This opens the Log Analyzer tab. Clicking the summary button will display a summary of the current log analyzer database. Initially, this is empty.
As the database expands, the summary might look something like the one below. It summarizes the entire database and summarizes the data for each type of Cube currently configured.
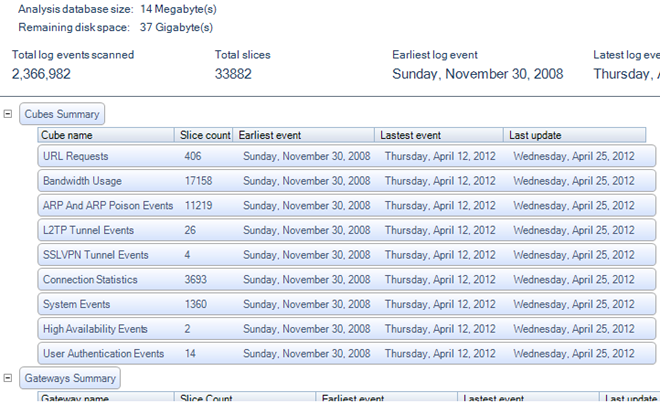
The term Slice is a data warehousing term and does not equate with the total number of statistics collected, it can only be used as a guide to the number. However, the number of slices for a cube compared with the total slices in the database indicates the contribution made by that cube.
Also displayed is the status of the background process which updates the database.
On the left of the Log Analyzer tab is the query builder for the log analyzer database. The query is constructed here and then the query is executed by pressing the Run button.
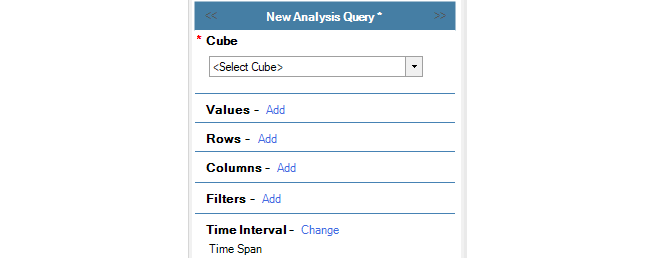
A query is built as follows:
Select the Cube (required)
The Cube is the type of statistics to be analyzed. The cube selected must be one of the cubes that the ILA is configured to store in the analyzer database. In the screenshot below, the Bandwidth Usage cube is selected for this example. The log message IDs included within each cube are listed in Appendix A, Cube Log Messages.
By default, the query is assumed to be the selected cube for all firewalls. This can be narrowed using the Filters option.

Select the Values (required)
The Values setting specifies which statistic from the selected cube is to be displayed in the body of the generated reports. In this example, the Total Bytes (sent plus received) will be displayed.
The red asterisk next to Values indicates that this is a mandatory parameter that must be specified next.

Select the Rows (required)
The Rows selection specifies what groupings make up the rows of the data table as well as along the X axis of the generated chart.
If nested time periods are required it is best to make them row selections and not column selections. The reasons for doing this are twofold:
Reports can become very wide when using time selectors in columns, which can therefore possibly not be displayed in a PDF document. However, this issue does not apply to an HTML document where horizontal scrolling is possible.
This provides mid-level summaries for time selectors in the rows. If this was done with columns, only grand total summaries would appear and not mid-level summaries.

Select the Columns (optional)
The Columns selection specifies what groupings are to be specified in the columns of the data table and along the Y axis of the generated chart. The same groupings can't be specified on for both Rows and Columns.
If the columns are not specified, the data table columns and chart Y axis default to the Values parameter.

Select the Filters (optional)
Further refinement of the query can be achieved using Filters. These allow boolean expressions to be added to the query. For example, the filter shown below specifies that only statistics for the firewall called My_FW are to be included in the query.

Select a Time Interval (optional)
By default, a time window is specified in a query. This is to prevent the administrator from accidentally launching a query which will go through all the statistics since the database can be very large. However, it is possible to query all statistics by selecting the All logs option from the Time Interval menu as shown below.

|
Note: Cube, Values and Rows are mandatory |
|---|---|
|
As indicated above, a query requires, at a minimum, the Cube, Values and Rows parameters to be set. |
Log Message Timestamping Uses UTC/GMT
The log messages sent by cOS Core to the ILA are always time stamped with the time in UTC/GMT. This is done so all firewalls use a common time reference regardless of their location.When constructing queries with the log analyzer which involve time, it should always be remembered that the time specified should be UTC/GMT and not the local time of the client or firewall.
However, the ILA also keeps a record of the local time when it receives the log message. In the reports generated from InControl log queries, the Time column is the local time when the log message was received by the ILA and the Device Time is the UTC/GMT timestamp on the log message added by cOS Core. An example of these two columns in report output from the log analyzer is shown below.

When the query is defined, the Run button is pressed to begin processing the data in the log query database.

The Last Hour's Data May Not Be Included
The background process which updates the database from the log files runs every 60 minutes. This means that a query will potentially not have access to as much as one hour of the most recently recorded log data. It also means that starting with an empty database, it takes 60 minutes before any data is written into it.In addition, a query must wait for this hourly background update process to complete if they are both running at the same time. Typically, this will delay the query for no more than a few seconds. However, in some cases where a large update is underway, the wait may become unacceptable and the query will need to be cancelled by the user.
Limiting the Number of Slices Processed
The lower part of the analyzer panel allows the number of database slices in a query to be limited. This is useful when the database becomes large. As mentioned previously, the number of slices do not equate to the number of statistics since there can be more than one statistic in a slice.

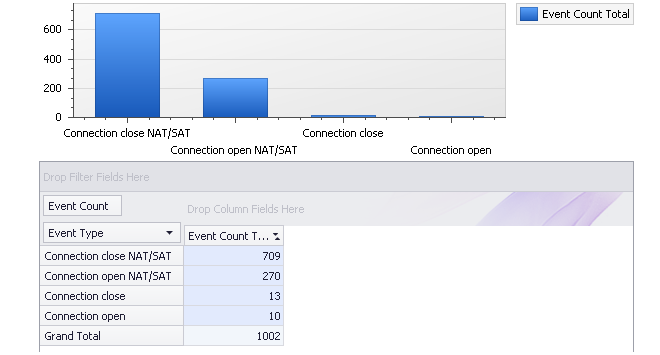
Below is shown an example query which examines connection events broken down by type over a period of time. The period selection is not shown but is limited to a particular time window.

After pressing the Run button the following bar chart is an example of what might be displayed with the data being summarized both in graphical and numerical form:
A log analyzer query can be saved to the InControl Object Library under a specific name by pressing the Save button.

A file chooser dialog for the InControl server's internal file system will appear and the query should be saved in the Log Analyzer folder with an appropriate name. The dialog also allows subfolders under Log Analyzer to be created to group related queries. Queries cannot be saved to external files. If a query is not saved in the Log Analyzer folder it will not be listed in the Open submenu which is described next.
A saved query can then be accessed and executed again through any of the following methods:Through the menu that appears when the Log Analyzer tab's Pressing the Open button in the Log Analyzer toolbar ribbon. Select the Log Query option followed by the Log Analyzer option and finally one of the queries that appears in the submenu.
The queries displayed in the final submenu consist of all the log analyzer queries saved to the Log Analyzer folder the InControl server's internal file system.
Through the Library Browser which is described in Chapter 24, The Library Browser.
If this predefined query is selected and executed, the resulting results graph is shown below and breaks down traffic in bytes over the previous calendar month by interface. The term Previous Month in the menu means the complete calendar month prior to the present month.
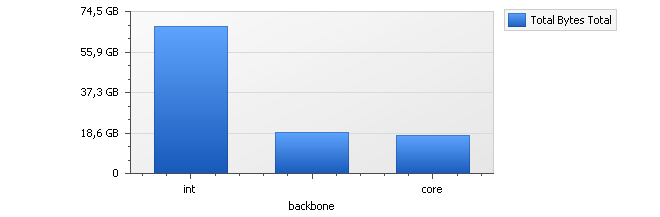
The three interfaces int, backbone and core are displayed in the graph because these are also the interfaces selected in the accompanying numerical results table. By selecting any other interfaces in the table, the barchart's contents can be changed.

Within the breakdown of statistics by interface, it is possible to break down a particular interface further into individual IP addresses. This feature is known as Drill Down.
For example, to drill down into the statistics for the interface called int, right-click on the int cell in the table to get a context menu.

By selecting Drill Down on Source Interface, the displayed barchart might become something similar to that shown below.
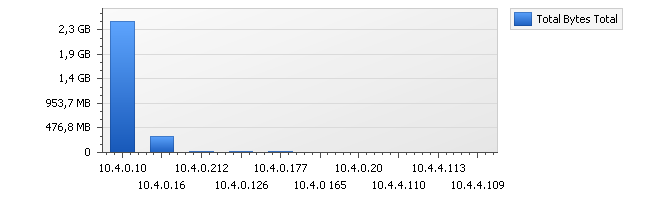
The table below the chart will also change to show the exact traffic breakdown by IP address.

The drill down behavior is different depending on whether the Auto drill down option is enabled. If it is enabled, double clicking a cell will automatically run a new query which assumes that a further data breakdown based on the possible fields. For example, we could have simply doubled clicked the table cell for the int interface above to drill down to the IP usage.
When this feature is disabled, double clicking will add to the left hand display of the query criteria but the query will not be run. This allows further modification of the query criteria before execution.
Changing the Database Software
As mentioned previously, by default the ILA uses the SQLite™ software product to build its database from log files and this product is installed as part of the InControl installation process. The SQLite database is always built on the same computer as the ILA server.The SQLite product is a fast and effective database solution for smaller InControl installations where the database size is not much greater than one gigabyte. For database sizes far in excess of one gigabyte, SQLite can present performance issues which will be seen in the speed of background updating and the response time to complex queries.
For installations requiring a large database size, one of the following two alternative databases should be used:
MySQL™.
MariaDB ColumnStore™ (recommended).
Both can provide a better database solution but are not supplied by Clavister. They must be installed as a separate standalone product. Of the two, MariaDB ColumnStore is recommended over MySQL, since it can provide much improved retrieval speeds with the kind of database queries that are typical.
Using MySQL or MariaDB ColumnStore
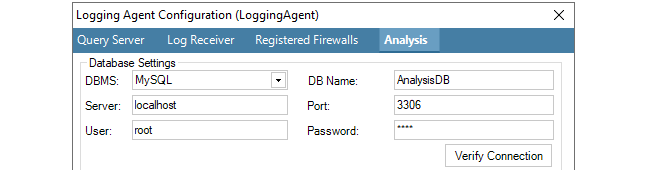
The Logging Agent Configuration dialog below shows how the DBMS setting is changed to configure InControl to use either MySQL or MariaDB ColumnStore. The DBMS field is always set to MySQL for either one of these databases. The database software can be running on the same or a different computer as InControl.
The following data fields will also be required for MySQL or MariaDB ColumnStore:
DB Name - This is the name of the database that InControl will create once the dialog is closed.
Server - The IP address of the database server. If the database is running on the same computer as the ILA server, this field should be set to localhost or 127.0.0.1.
Port - The port that the database listens on. The default port is 3306.
User - The username which InControl will use for access. Within the database software this user needs the following privileges:
The ability to create databases.
Read and write access.
Password - The password associated with the username.
As soon as the dialog changes are saved, the database will be created by InControl and the data will begin to be added. Any existing log files will be written into the database. However, migration of data from the old SQLite database is not possible.
Increasing the Maximum Sort Data Length in MariaDB ColumnStore
If no data is being returned by ColumnStore, the problem may be fixed by increasing the value of the ColumnStore parameter max_length_for_sort_data.The reason for switching to this new directory path for the ILA SQLite database is that the client initiating the change cannot know which version of Windows server is running on and therefore where the original SQLite database was placed at installation time.
Advanced Database Settings
In the dialog that defines the database used, there are fields that allow the setting of the location for temporary data, the retention time and resetting of log indexing.

The Temporary Data location is the directory used for storing processed log data prior to it being added to the database. These files are not in a readable format and are kept in the temporary folder only for a very short time. The files should not be opened outside of InControl as this can terminate the processing of the data. In addition, if the default temporary location is space constrained, it is recommended to specify an alternative location since the amount of space required can be many gigabytes.
The Retention Time is how old the data in the database can become before it is automatically deleted during routine hourly maintenance. It is up to the administrator to determine an appropriate value. It should be based on the amount of free disk space available and the expected rate of increase in the database size. A useful exercise for making this determination is to observe the size expansion over a few days of typical system usage.
When running on the same computer as the InControl server, the space used by the log analyzer database will contribute to the alert that the InControl server generates should free disk space fall below the configured value.
The button Re-scan Logs gives the administrator the ability to delete and then rebuild the log analyzer database from the raw log message data that has been retained by the log receiver. The raw log data that is available will depend on the retention time setting in the log receiver properties (described in Section 23.2, The InControl Logging Agent (ILA)).
When the re-scan option is selected, a further dialog will appear so a particular day can be chosen.

All historical data in the database prior to the date selected is discarded and only data from that date onwards will be retained and be available for analysis. However, it may be that the available raw log data begins after the selected date.
![[Important]](images/important.png)