| Home Prev | Next |
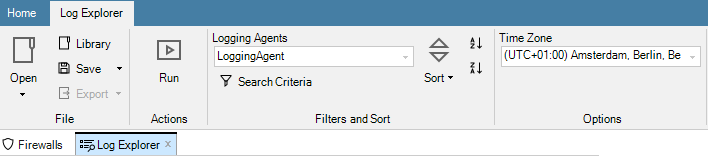
The InControl client provides extensive tools for looking at both real-time ILA logging and examining the log event history kept in the ILA database for cOS Core. To start doing either, press the top part of the Log Explorer button.

Provided an ILA instance exists, the Log Explorer tab will open.
Building Log Queries
The Query Builder is displayed as part of the Log Explorer tab and it allows log queries to be constructed and saved.
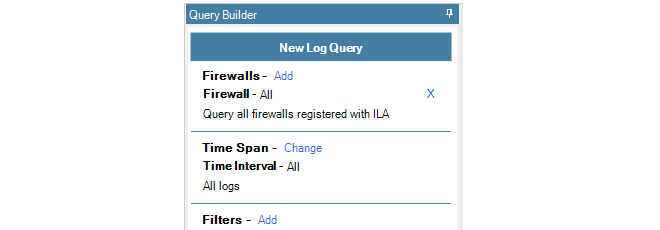
Select the Add option to choose which firewalls will be included in the query. In the example below, only one firewall is selectable and it is called SG50-492.

When selected, this firewall now becomes part of the query.

Multiple firewalls can be added to the list of firewalls for the query.
Displaying ILA Log Messages in Real-time
To show the logging that is taking place to an ILA server from the selected firewalls in real-time, press the Change link for Time Span and select Real Time from the menu.

The above steps defined a simple query which was showing real-time logging for a particular firewall. Once a query is defined, it needs to be executed and this is done by pressing the Run button in the toolbar.

The results of the query are then displayed in a list. Below is an example of this output.
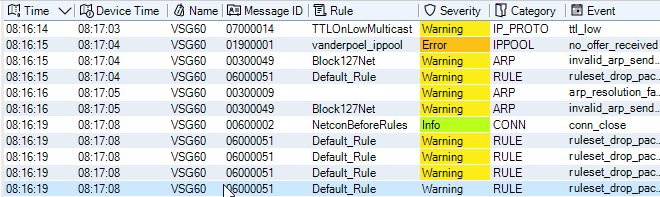
By clicking on any line in the query output, the details of the individual log message can be displayed in a separate lower pane. Below is an example which corresponds to the highlighted line in the previous image.
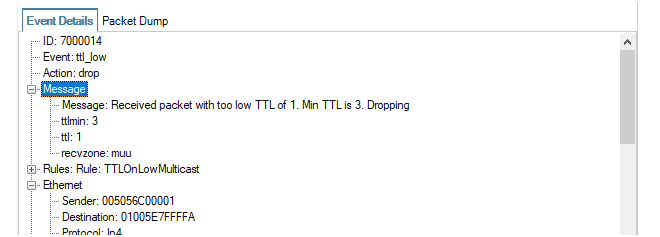
In addition, it is possible to copy to the clipboard information relating to a particular value in the details pane by right-clicking it and choosing one the options from the context menu that is displayed. Below is an example.
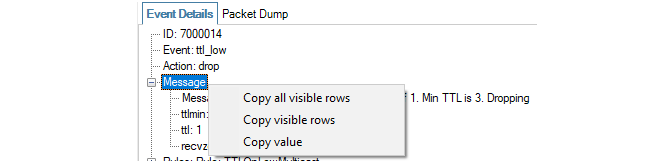
Note that the context menu feature will not work on all message fields, only those which make data available such as IP address fields.
Also note that the under the log message detail pane is a status line that displays useful summary information about the query, both while it runs and after it completes. This includes information about the amount of data processed and the time window that was scanned.

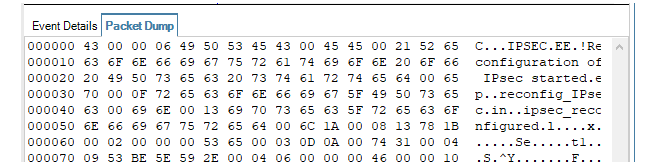
If required, the hex version of the log message can be viewed by selecting the Packet Dump tab. An example is shown below.
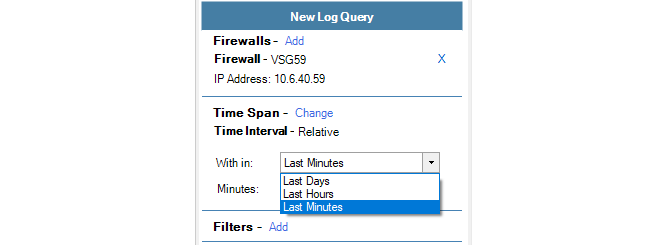
Displaying Logs Using Relative Time
Instead of the real-time option, relative time can be selected.

This view of log messages looks backwards from the current time. A drop-down menu is used to select the desired unit of time and a slider control is used to select the number of the chosen time unit.
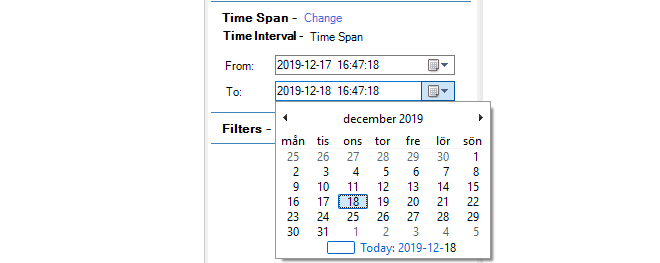
Displaying Logs Using a Time Span
The time span option allows the display of all logs in a specific time range.
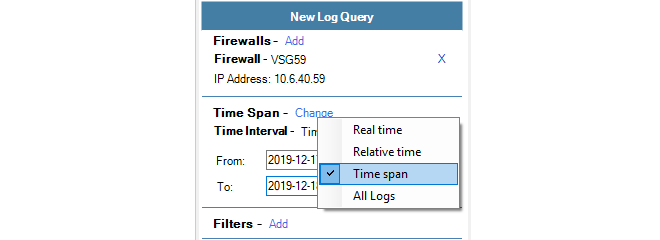
This view of log messages looks backwards to a specific time range which is specified using two date fields.
Except for real-time log display, other options have the potential to display large numbers of log messages. This is usually always the case if the All Logs option is chosen.

To refine the displayed logs further, the Filter option can be chosen so that one of more filter data types can be matched against specific criteria. When the option is chosen, a data type can be selected from a large menu of choices.

After a filter data type is chosen, a boolean operator and a value can then be specified. In the example below, the action must equal Allow for the log message to be displayed.

The applied filter can consist of several boolean expressions for different types of data. Below, a second condition to be added to filter out messages that have a severity equal to Warning.

If there is than one filter condition, they can be combined either with a logical AND or a logical OR depending on the selection made from the combination choices.
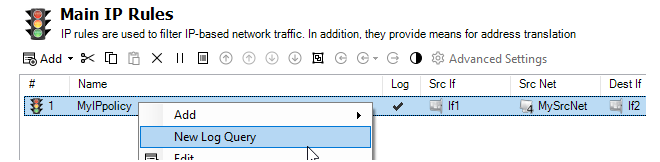
Creating Queries from IP Rule Set Entries
An alternative, and sometimes more convenient method of creating a log explorer query is directly from cOS Core IP rule set entries. This is done with the following steps:Right click an IP rule set entry and select the New Log Query option.
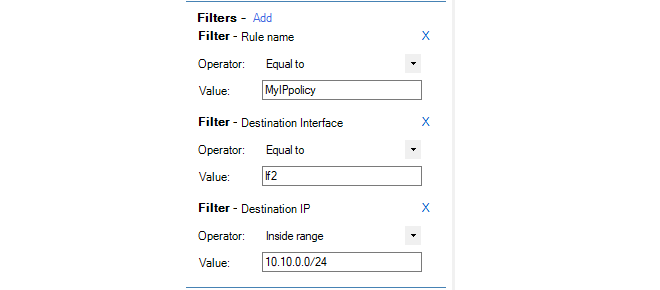
A dialog opens which allows any of the properties of the IP rule set entry to be selected to create a new log explorer query.
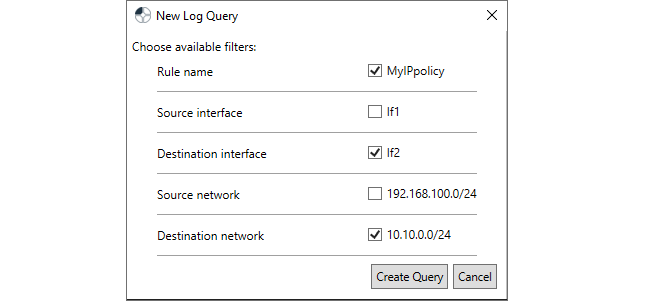
After confirming the dialog above, the selection is displayed in the normal query builder so it can be run or modified further.
By default, a Log Explorer tab's current time zone is taken from the InControl client's host Windows system. However, the time zone can be changed so that the times on log messages are displayed in terms of an alternative zone and any time ranges entered in queries can also be entered in terms of that new zone. The current time zone is displayed by a drop-down box in the toolbar ribbon for the log explorer, along with the alternative choices.

The following should be noted about the log explorer time zone setting:
The time zone selected will apply only to the Log Explorer tab in which it is selected. Multiple Log Explorer tabs could use different time zones. A new Log Explorer tab will always default to the time zone of the host Windows system.
The selected time zone is saved along with a saved log explorer query and that time zone will be used whenever the saved query is executed.
Log explorer queries that were saved in an InControl version prior to 3.10.00 will always use UTC+0 as the time zone when run using version 3.10.00 or later.
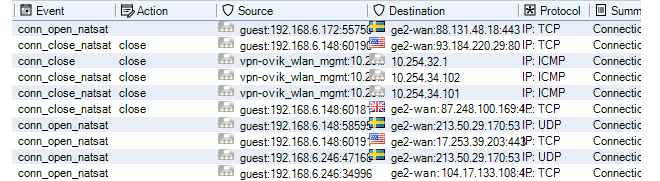
To further clarify, GeoIP must be configured and used in cOS Core in order to display the country flags.
Exporting Log Query Results to a File
Once a query has run, the results of that query can then be exported to a file in one of a number of formats.The export option can be found in the log explorer's toolbar ribbon.
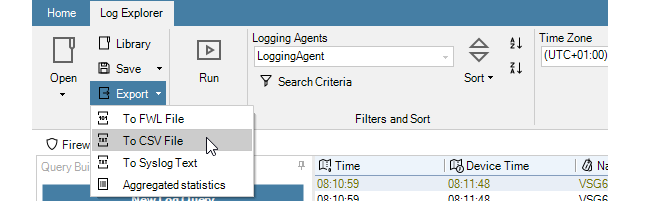
The options available are:
FWL format - This is Clavister's proprietary binary format intended to only be viewed inside InControl.
CSV format - A format that is easily importable to a variety of analysis tools, such as Microsoft Excel™.
Syslog format - The standard Syslog text file format.
Aggregated Statistics - This is a text file which provides a summary of the number of log events that were retrieved of various types. For example, the number of events that contained each source IP address or the number of events for each log category.
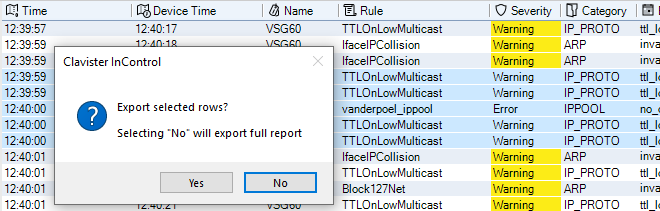
When exporting to a file, selections of certain report rows can be made first by using mouse clicks with the Ctrl button depressed. When the export is performed, the InControl client will now ask if only the selected rows should be exported or the entire report.
The most recent log explorer query can be saved so that it can be quickly run again. This is done by selecting the Save option in the toolbar ribbon, or alternatively the Save as option.

The following should be noted about saving queries:
Queries are stored in the InControl server database. They cannot be saved to external files.
The name given to a saved query is arbitrary and does not require a specific format and does not get a default name.
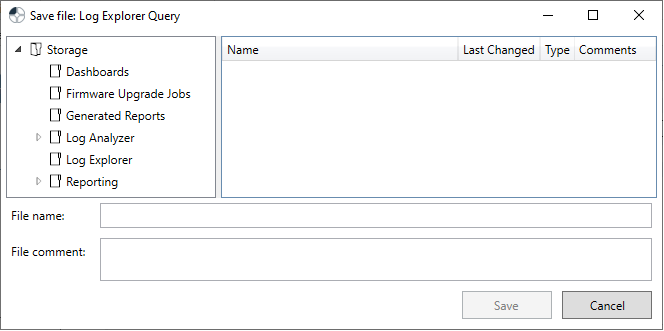
When saving a new query for the first time, the Save and Save as options do the same thing and will open the same file chooser dialog for assigning a name to the saved query.
The file chooser dialog (shown below) displays the InControl server's own file system and it is possible to save a query anywhere but it is recommended to store them in the Log Explorer folder so they can be included in the Open submenu. It also possible to create new a new folder for storing queries.
Note that the InControl's server's internal file system can be browsed at any time by pressing the Library Browser button in the Home toolbar ribbon.
Once a query is initially saved, selecting the Save option again will just overwrite the previously saved query and the naming dialog will not be displayed. The Save as option should be selected if the query has been modified and the new version is to be saved using a different name.
How to open a saved query is discussed next.
Opening a Saved Query or Saved Report
The Open button in the log explorer toolbar ribbon provides the ability to open a previously saved query or a report saved in the proprietary .fwl format.
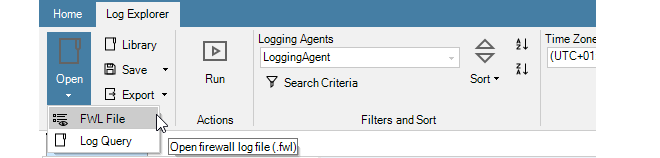
In more detail, the two menu options are:
FWL File
This allows the user to browse and read the raw log data that has been received from firewalls associated with an ILA instance. These are stored using a Clavister proprietary file format that has the suffix .fwl. This is a binary format intended to be viewed only inside InControl.
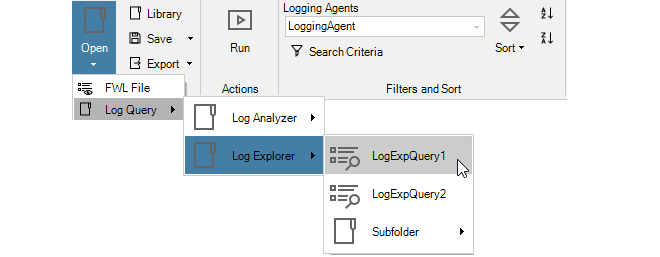
Log Query
This displays a further choice between saved Log Analyzer reports and saved Log Explorer queries. An example submenu for the Log Explorer option is shown below. This displays all the queries saved in the Log Explorer folder of the InControl server's internal file system.
Note that, like log analyzer queries, log explorer queries can also be opened through the Library Browser which is described in Chapter 24, The Library Browser.
![[Tip]](images/tip.png)