| Home Prev | Next |
For each node that sends logs to InCenter, a number of dashboards are available in the WebUI which provide both details and a summary of node activity. These dashboards provide information in both a graphical and numerical way.
nodes should first be correctly configured to send log messages to InCenter. The node configuration steps are described in Section 6.3, Setting Up Monitoring. In addition, a node should also have been added to InCenter and doing this is described in Section 6.3.1, Adding NetWall Nodes with the WebUI. It is not necessary for a node to be under full centralized control by InCenter for monitoring to function.
The No-Logs Message
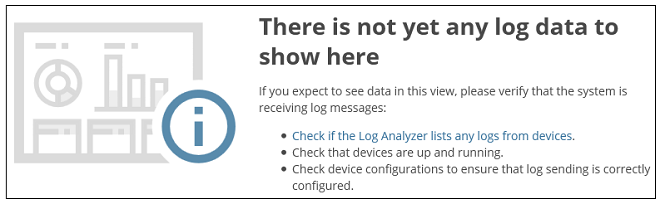
When trying to display dashboards for the first time, the message shown below might appear to indicate that no log messages are available for dashboard display.The above message appears for one of the following reasons:
InCenter aggregates log messages every five minutes and so the first log messages received may not have been aggregated yet. Waiting a few minutes before refreshing the dashboard should resolve this issue.
InCenter has not received any logs from any nodes. The actions given in the no-logs message should be followed to troubleshoot this problem.
Each dashboard provides numeric and graphical summaries of the historical activity for the nodes that have been added to InCenter. Every dashboard has common controls for filtering the information displayed. This filtering can be by:
Node
A particular node can be selected from a drop-down menu.
Multiple nodes can be selected in this way to view the aggregated events from those nodes. The Clear All Filters button can be used to clear all the dashboard filters and return to the default settings.
The most recent period of time can be selected from a drop-down list. This period can range from the last 5 minutes to the last 30 days. Note, however, that the default time of keeping log messages is 3 days and only aggregated data is kept for up to 30 days.
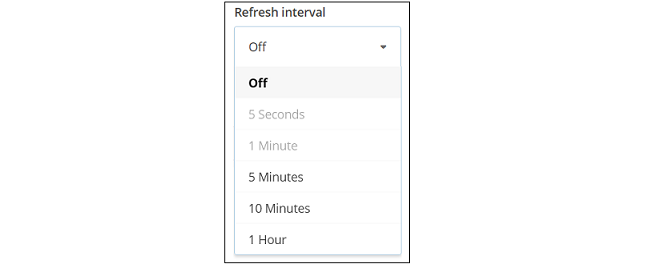
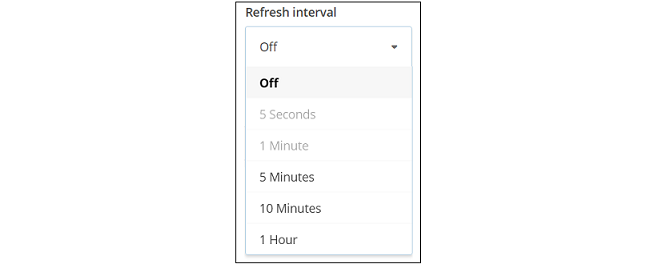
The refresh interval determines how often the dashboard will be automatically refreshed by InCenter. This can be switched off or set at different refresh intervals up to a maximum of one hour.
The administrator has a choice of viewing dashboards in a view mode of Fast or Rich. The Fast option makes use of aggregated log message data. The slower Rich option makes use of the raw log message data but also allows drill-down into that data.
The following should be noted about using these options:
Since the Fast mode relies on aggregated data and because data aggregation by InCenter takes time to complete, using this mode with a short time window of five minutes or less may result in the dashboard display being empty and not showing any node activity.
Log message data is kept for a maximum of one year.
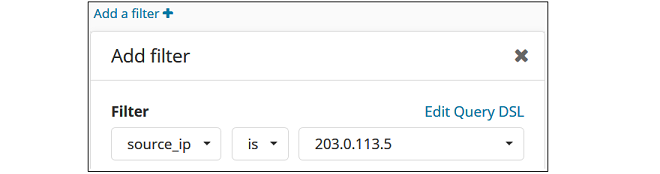
Alternatively, it is possible to build complex queries using the query DSL search language by clicking the Edit Query DSL option.
Note that this filter type is not removed if the Remove All Filters button is pressed. Instead, the delete "cross" button on the filter must be pressed to remove it.
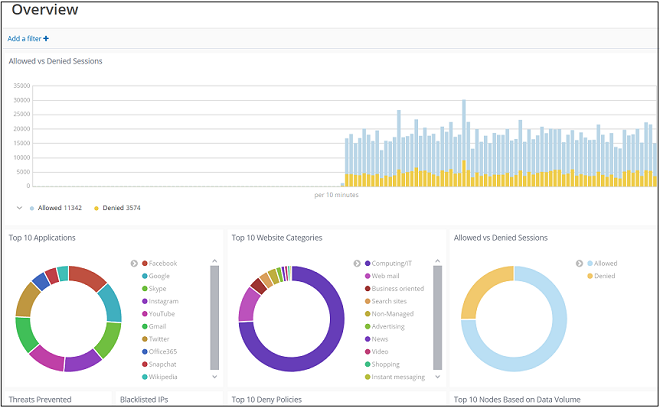
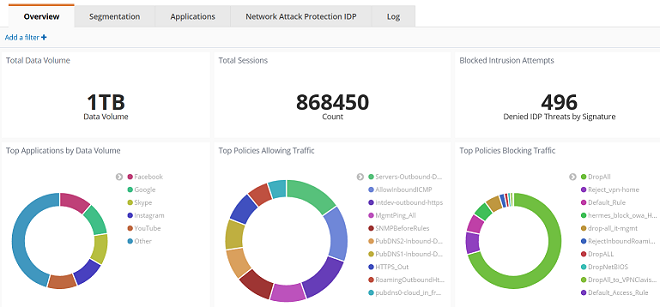
When the InCenter interface is first opened, the default Overview dashboard is presented. This is an overall summary of recent activity for all monitored firewalls. This summary can be displayed at any later time by selecting the Overview option.
Below is an example of the information presented by the first part of the summary.
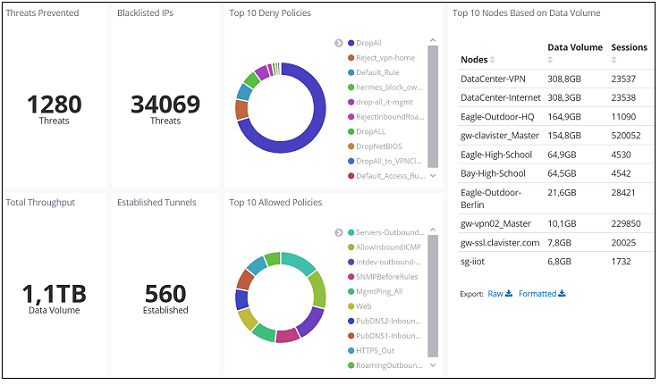
The second part of the summary provides further graphical represenations of the overall node activity plus a tabular summary of the 10 most active active nodes in terms of data volumes.
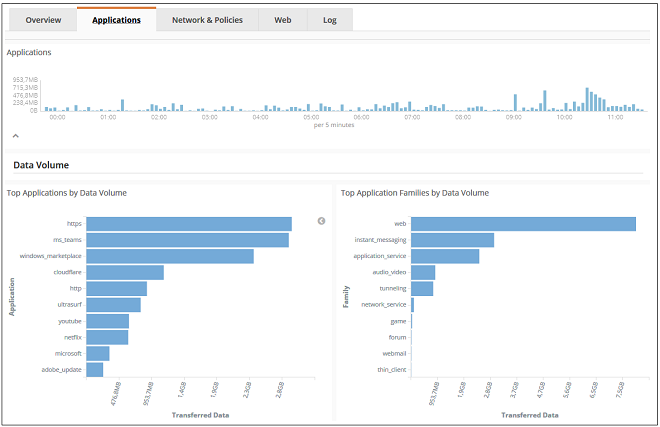
The Network Allowed dashboards present an overview of traffic sources that have been allowed by the IP policies of monitored firewalls. An example of the initial dashboard display is shown below.
The various tabs in this dashboard present the following information:
Applications
This summarizes the allowed connections that have been processed by application control.
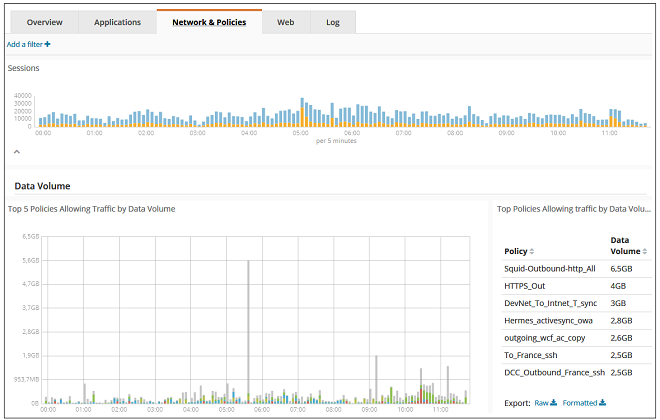
Network & Policies
This presents the source IP addresses that were allowed.
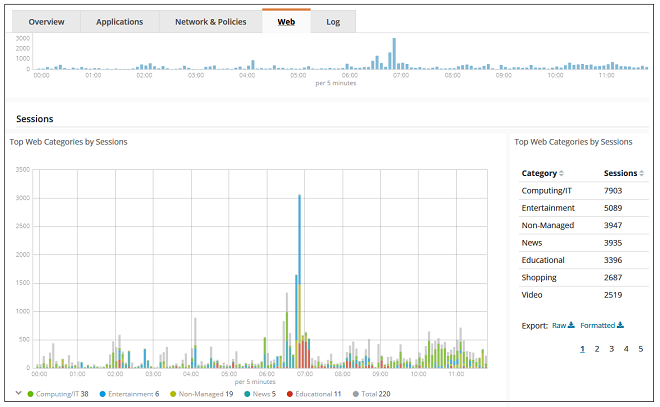
Web
This summarizes the types of URLs that were allowed by web content filtering.
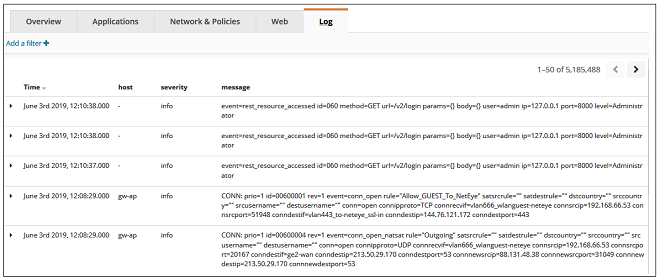
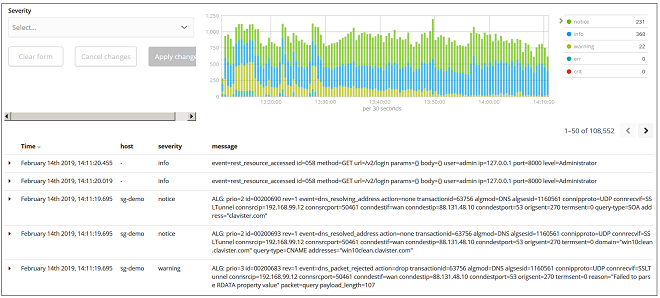
Log
This is a list of the log messages received.
The Network Denied dashboards present the sources of traffic that has not been allowed by IP policies. It can be viewed as the opposite of the Networks Allowed dashboards. The tabs also present the denied networks by type, corresponding to the same tabs in the Network Allowed dashboard.
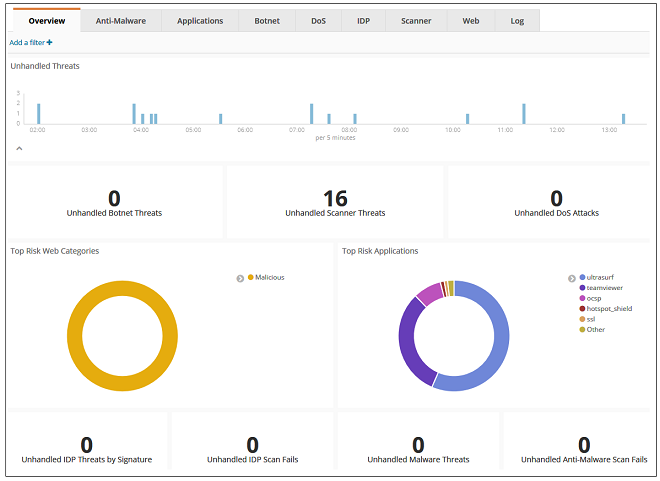
The Threats Unhandled dashboards are similar to the Threats Denied dashboards but provide an overview of threats that were detected in the "high risk" or "very high risk" categories but which were not blocked.
It may be often desirable to introduce security policies which first audit threats instead of blocking them straight away. This dashboard can give the administrator a way to gauge the effect of changing policies from auditing to blocking.
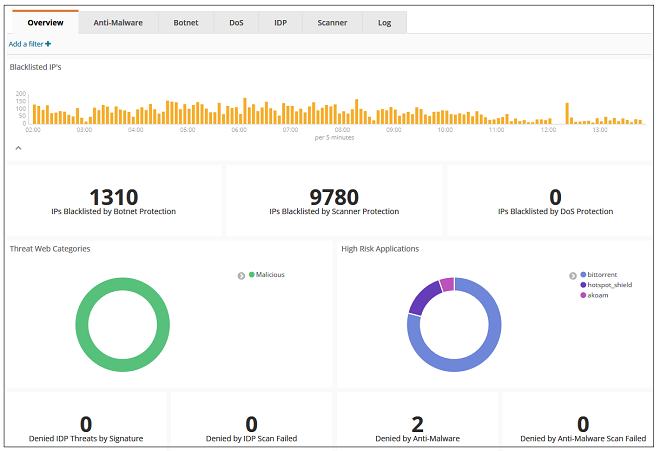
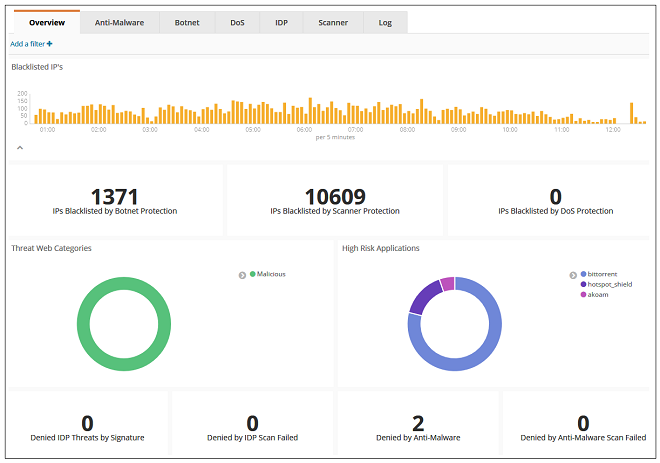
The Threats Denied dashboards present an overview of threats that have been blocked by monitored firewalls. An example is shown below where a time range of 24 hours has been selected.
The following tabs allow a further breakdown of the denied data:
Anti-Malware
This summarizes connections dropped by anti-virus scanning.
Botnet
This summarizes connections dropped by botnet protection.
DoS
This summarizes connections dropped by DoS (denial of service protection).
IDP
This summarizes connections dropped by the intrusion detection prevention (IDP) subsystem.
Scanner
This summarizes connections dropped by scanner protection.
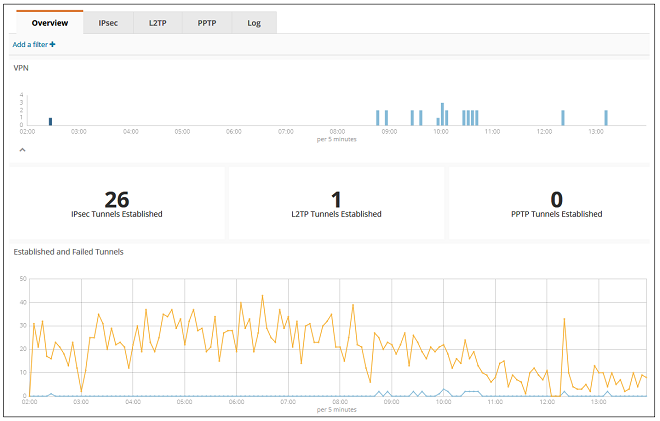
The VPN dashboards present a summary of activity related to IPsec, L2TP and PPTP tunnels. Selecting one of the protocol specific tabs provides more detailed information about each protocol.
Note that SSL VPN traffic monitoring is covered by Section 6.4.8, OneConnect.
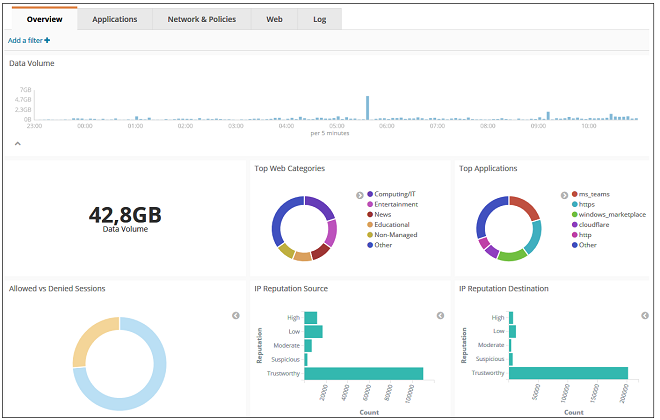
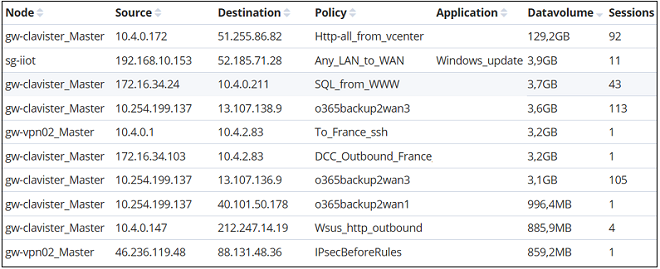
The Communication dashboard presents a summary of the traffic that is passing through nodes between external hosts and devices. An example of the first part of the communication summary page is shown below.
The second part of the communication summary page provides a tabular summary of the IP rule set entries that are triggering within nodes in order to allow traffic. Columns within this table provide detailed information on how many connections are being allowed for each listed rule set entry and how much traffic is flowing.
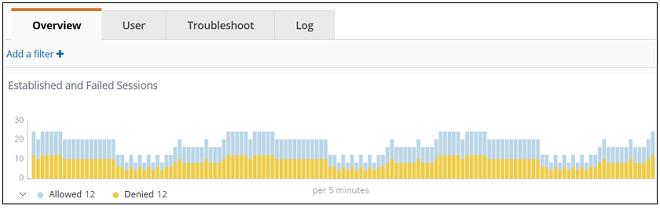
The OneConnect dashboard presents the activity of users who are connecting to a NetWall node over SSL VPN using the OneConnect client. Below is an example of the first part of the summary for OneConnect.
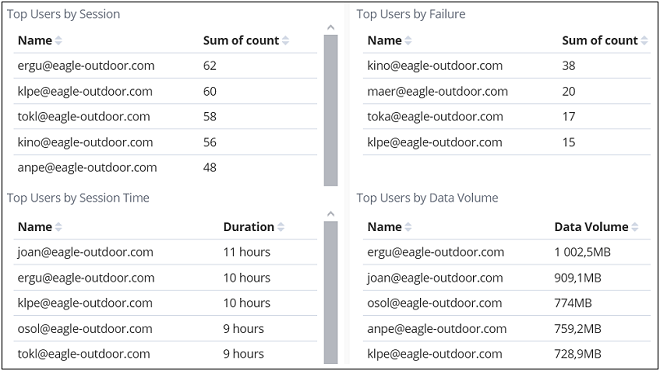
The second part of the summary page presents the top users in terms of connections, failed connections, traffic and session time.