| Home Prev | Next |
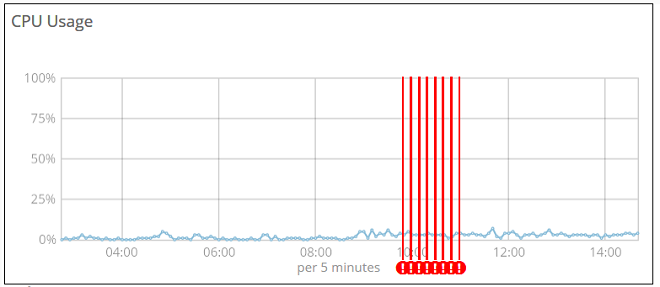
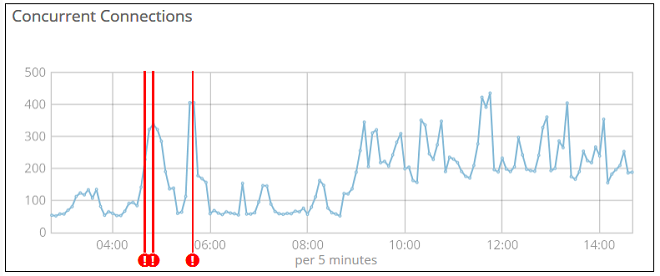
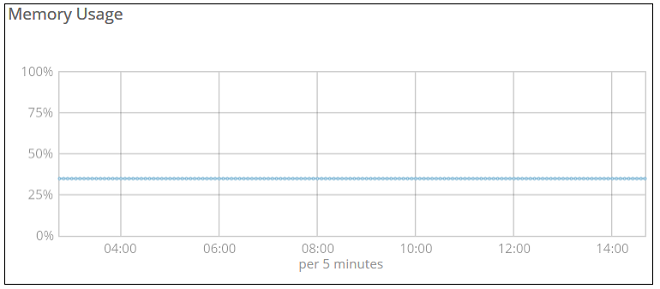
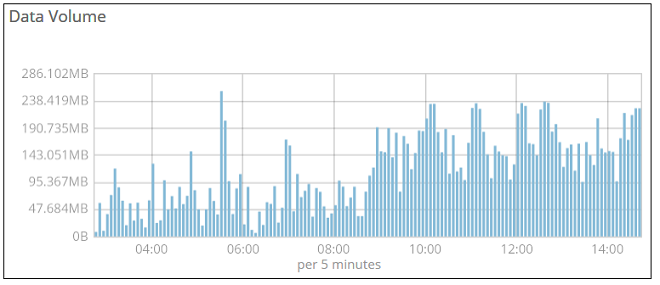
The Health display for each firewall summarizes the overall health of the node by displaying the recent levels for CPU load, memory usage, data volume and concurrent connections.
The health display is different from dashboards in that the source data is node generated telemetry data that is always sent every 5 minutes, regardless of what configuration objects exist in the firewall.
To display the health of any firewall, select the node in the node list and then press the Health button.
The health display will open up. The screenshots below show examples of the graphs displayed.
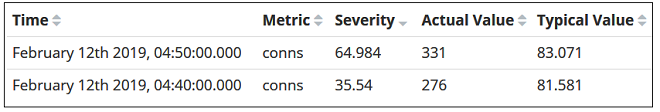
The health display uses machine learning software to track the values of the health telemetry and indicate any anomalies with a red line on the graphs and add these to an anomaly list at the bottom of the page.