| Home Prev | Next |
cOS Stream provides a set of CLI commands to help with troubleshooting problems. These commands are described in this section.
When troubleshooting networking problems, one of the most useful tools is the CLI ping command. This command can send one of more ICMP ECHO, TCP or UDP packets to a specified IPv4 or IPv6 address and reports the reply that is received.
A Simple ICMP Example
The simplest example of ping usage is sending an ICMP ping message to the IPv4 address 10.4.0.2. The CLI command would be:System:/> ping 10.4.0.2System:/> ping 10.4.0.2 -routingtable=my-rtableSpecifying the Protocol and the Message Load
The ICMP ECHO, TCP or UDP protocols can be used when sending a message, with ICMP being the default. The protocol option is specified immediately following the ping command. For example, to send a UDP message to 10.4.0.2, the command would be:System:/> ping -udp 10.4.0.2System:/> ping -tcp 203.0.113.10 -port=80 -request="GET /HTTP/1.0\n\n"System:/> ping c1a1::1:2
Sending 4-byte ICMP ping to c1a1::1:2:61083 from c1a1::1:1:128
4-byte ICMP reply from c1a1::1:2:61083 to c1a1::1:1:129System:/> ping 10.4.0.2 -vThe verbose options are required when performing ping traffic simulation (described next) in order to see the configuration elements that are triggered during the simulation.
Incoming Packet Simulation Using the -srciface and -srcip Option
In addition to testing the responsiveness of a remote host, the ping command can be used to simulate incoming traffic on a given interface and thereby test how the current configuration responds to different types of traffic. This is done by using the -srciface option to specify the interface that will appear to be receiving the message generated, along with the -srcip option to specify the source IP address of the message.For example, the following command would simulate an incoming ICMP ping message arriving on the if2 interface that was coming from the source IP address 192.168.0.10:
System:/> ping 10.6.58.10 -srciface=if2 -srcip=192.168.0.10 -verboseThis command will construct an ICMP packet with a destination IP of 10.6.58.10 and cOS Stream will behave as though that packet had arrived at the interface if2 and had come from the external IP address 192.168.0.10.
Note that the simulated traffic received in this way will be treated by the configuration as normal traffic. This means that such configuration elements as IP rules will be applied so any relevant NAT or SAT actions will also be applied. The traffic might even be dropped. Also note that the -routingtable option cannot be used with the -srciface option as it has no relevance in this context.
If there is no route that matches the combination of source IP address and receiving interface, the packet will be dropped. Some example output when this happens is listed below:
System:/> ping 192.168.14.1 -srciface=if14 -srcip=192.168.14.12 -verbose
Simulating 4-byte ICMP ping to 192.168.14.1:44434
  from (if14) 192.168.14.12:8
(Response is not displayed when '-srciface' is used)
SNOOP:  POLICY-1  : Forward lookup matched PBR rule "RoutingRule_1"
  (id 0x3039) against <ICMP if14;192.168.14.12:2048 -> 192.168.14.1:44434>
SNOOP:  POLICY-1  : Drop <ICMP
  if14;192.168.14.12:2048 -> 192.168.14.1:44434>:
	No route to source in table "Main" (ID: 0x20).
For the ping message not to be dropped, there must not only be a route that matches the source IP address and source interface combination but also an IP rule set entry that allows the traffic on that interface. If the administrator simulates the packet arriving on the if2 interface and going to some host on the network if1_net, the allowing IP rule set entry might be the following:
| Action | Source Interface |
Source Network |
Destination Interface |
Destination Network |
Service |
|---|---|---|---|---|---|
| Allow/NAT | if1 | if1_net | if2 | all-nets | ping-inbound-ip4 |
If there is no IP rule set entry that allows the traffic it will also be dropped. The following example shows some example console output when this happens:
System:/> ping 192.168.14.1 -srciface=if14 -srcip=192.168.14.12 -verbose
Simulating 4-byte ICMP ping to 192.168.14.1:2524
  from (if14) 192.168.14.12:8
(Response is not displayed when '-srciface' is used)
SNOOP:  POLICY-1  : Forward lookup matched PBR rule "RoutingRule_1"
(id 0x3039) against <ICMP if14;192.168.14.12:2048 -> 192.168.14.1:2524>
SNOOP:  POLICY-1  : <ICMP if14;192.168.14.12:2048 -> 192.168.14.1:2524>:
  Found reverse route "Route_3" (ID: 0x3ead62f) 192.168.14.0/24 ->
  if14 (Gateway: none) in table "Main" (ID: 0x20).
SNOOP:  POLICY-1  : <ICMP if14;192.168.14.12:2048 -> 192.168.14.1:2524>:
  Found forward route "Route_3" (ID: 0x3ead62f) 192.168.14.0/24 ->
  if14 (Gateway: none) in table "Main" (ID: 0x20).
SNOOP:  POLICY-1  : Matched default rule "System::DefaultDrop"
SNOOP:  POLICY-1  : Dropped by default rule "System::DefaultDrop"
SNOOP:  POLICY-1  : <ICMP if14;192.168.14.12:2048 ->
  192.168.14.1:2524>: Dropped by IP rules
Once both the routing problem and the IP rule problems that were indicated in the above two output examples are fixed, the following is an example of some problem-free output:
System:/> ping 192.168.14.1 -srciface=if14 -srcip=192.168.14.12 -verbose
Simulating 4-byte ICMP ping to 192.168.14.1:24093
  from (if14) 192.168.14.12:8
(Response is not displayed when '-srciface' is used)
SNOOP:  POLICY-1  : Forward lookup matched PBR rule "RoutingRule_1"
  (id 0x3039) against <ICMP if14;192.168.14.12:2048 -> 192.168.14.1:24093>
SNOOP:  POLICY-1  : <ICMP if14;192.168.14.12:2048 -> 192.168.14.1:24093>:
  Found reverse route "Route_3" (ID: 0x3ead62f) 192.168.14.0/24 -> if14
  (Gateway: none) in table "Main" (ID: 0x20).
SNOOP:  POLICY-1  : <ICMP if14;192.168.14.12:2048 -> 192.168.14.1:24093>:
  Found forward route "Route_3" (ID: 0x3ead62f) 192.168.14.0/24 -> if14
  (Gateway: none) in table "Main" (ID: 0x20).
SNOOP:  POLICY-1  : Matched rule "iprule_all_services" with id 0xdaa96f5
SNOOP:  POLICY-1  : Allow <ICMP if14;192.168.14.12:2048 ->
  192.168.14.1:24093>: route via if14
Specifying Only the -srcip Option
The -srcip option can be used without -srciface when traffic is not being simulated. This usage allows an outgoing ping message to originate from a specific source IP address. For example, to send an ICMP ping from the IPv4 address 192.168.0.5 to 10.4.0.2, the command would be the following:System:/> ping 10.4.0.2 -srcip=192.168.0.5The source IP specified is one of the addresses that is configured on the sending interface.
If a route lookup is done on the source address, it is routed on the core interface.
All ping command options are listed in the separate CLI Reference Guide.
During system operation, important troubleshooting information is saved in system memory by the Dconsole subsystem. This information takes the form of time stamped messages which record both normal events such as system restarts but also any abnormal system events. These messages can be retrieved at any time using the CLI command:
System:/> dconsoleThe output generated by the dconsole command provides an important diagnostic tool that can help to determine the cause of a system problem. However, it should be remembered that interpreting the output is often best done by sending the information to qualified support personnel.
Message Content
Each dconsole message that is written during system operation includes the following information:Some typical output from the dconsole command is shown below:
System:/> dconsole
Showing diagnose entries since 2025-11-22:
2025-11-22 07:58:10.943  01:14:32.856  INFO  CONFIG,SYSTEM  vsinit
Beginning system reconfigure [type=Activate][reason=Updated
configuration] [0e925f4f]
2025-11-22 07:58:12.220  01:14:34.132  INFO  CONFIG,SYSTEM  vsinit
Reconfigure completed successfully [11895f4f]
Here, the dconsole command is used without any parameters and by default only messages stored for today are displayed. The first message retrieved indicates the time of a reconfigure. The second indicates the reconfigure has been successfully completed.
All the recent dconsole messages could have been displayed by using the command with some previous date specified:
System:/> dconsole -show -date=2024-10-20
The Message Buffering Mechanism
A finite amount of volatile memory is allocated for the buffering of dconsole messages. Typically, this buffer holds around a thousand messages although this number can vary because of the variable message length. The contents of this buffer are lost between system restarts.When the volatile memory buffer is full, the newest message overwrites the oldest message. At certain times, the entire buffer is copied to a non-volatile memory file called dcon.bin and then the buffer is cleared. These copy operations occur when:
A system event with a Critical or High priority occurs.
Or the volatile memory buffer is explicitly flushed with the command:
System:/> dconsole -flush
When the copy operation occurs, the messages in the volatile memory buffer are appended to the existing messages in the non-volatile file dcon.bin. After the copying is complete, the volatile memory buffer is automatically cleared and begins to fill up again with new messages.
Messages can be appended to the non-volatile file until the configured maximum size of the file is reached. When this happens, cOS Stream erases the oldest 50% of the messages to clear space for new appended messages. The newest 50% of messages in the file are preserved.
During system startup the non-volatile file is allowed to temporarily grow beyond its configured maximum to accommodate any messages generated. This deals with the case that the file may be close to its size limit at startup but vital troubleshooting information still needs to be retained if a problem occurs.
The Volatile Memory Buffer is Circular
The volatile buffer is circular which means that new messages overwrite the oldest messages when it becomes full. When overwriting occurs, a dconsole message is generated that takes a form similar to the following:2025-11-22 09:47:28.632 43:10:26.415 INFO LOG dconsole 139 Message list Messages got Overwritten
Manually Clearing All Messages
All messages currently held in dconsole storage can be removed with the command:System:/> dconsole -cleanFiltering Messages
When output reports are generated, dconsole scans all the available messages in both volatile and non-volatile memory. The command provides a variety of options for filtering this output since the total number of available messages may be high.For example, to show all events that have a severity of Critical or higher, use the command:
System:/> dconsole -show -severity=Critical
To show all events that were generated after and including 2025-11-22, use the command:
System:/> dconsole -show -date=2025-11-22
To show all events related to the system vsinit component, use the command:
System:/> dconsole -show -app=vsinit
To show all events related to the system dataplane component, use the command:
System:/> dconsole -show -app=dataplane
For a full list of dconsole command options, refer to the separate Clavister NetShield Firewall CLI Reference Guide.
A valuable diagnostic tool is the ability to examine the packets that enter and leave the interfaces of a Clavister NetShield Firewall. For this purpose, cOS Stream provides the CLI command pcapdump which allows the recording of packets entering and leaving all or certain interfaces. The captured packets can be stored in a file and/or displayed on the console in an easily readable text form. Filters can also be applied so that only packets meeting specific criteria are recorded.
This section focuses on some of the important options for using the command. The complete syntax of the pcapdump CLI command is described in the cOS Stream CLI Reference Guide.
![[Important]](images/important.png) |
Important: Pcapdump requires sufficient control plane memory |
|---|---|
|
The pcapdump command requires that the control plane free memory space to be at least 100 MBytes. If this is not available then the pcapdump command will come back with a message saying that it has insufficient memory. This problem should only occur in a virtual environment and to resolve it, the virtual machine should be stopped and the memory allocated to cOS Stream should be increased. One Gigabyte of RAM for the whole virtual machine should be a minimum. The CLI memory command can show the amount of available memory in the control plane.
|
The Command View Needs to be Changed
The pcapdump command is not available in the default CLI view. The CLI view must be changed to at least debug with the following command:System:/> cmdview debugA Simple Example
An example of pcapdump usage is the following sequence which will record the packet flow on the if3 interface:Recording is started for the if3 interface with the following command:
System:/> pcapdump -start if3
Starting packet capture on: if3
By default, output is automatically saved to a file and no output appears on the console. Only one interface name can be specified in a command. To capture a group of interfaces, a pcapdump -start command must be issued for each interface. The following command with no interface specified will record packets on all interfaces:
System:/> pcapdump -start
The total number of packets captured can be limited with the -count option. cOS Stream will total the packets arriving and the packets leaving to determine if the count specified has been reached. To capture just the first 100 packets on the if3 interface, the command would be:
System:/> pcapdump -start if3 -count=100When the specified packet count is reached, the capture will be stopped automatically and a message will be output to the console. An example of this message for the command above could be:
if3: Packet capture stopped (packet count reached).
Packets have been saved to file "if3_2025-11-22_15.32.12.cap".
The currently enabled packet capture can be viewed along with the number of packets recorded so far by using the -status option:
System:/> pcapdump -status
             PCAP Status

Interface Mode   Packets(In)   Packets(Out) Filter
--------- ------ -----------   ------------ ------
if3       ACTIVE 9             5
Recording can then be stopped for if3 with the -stop option:
System:/> pcapdump -stop if3
Stopping packet capture on: if3.
Interface Pkts(In) Pkts(Out) Saved to file
--------- -------- --------- ---------------------------
if2       3        4         if3_2025-11-22_16.32.12.cap
The name of the file used for the saved output consists of the interface name and the date and time when the recording is stopped. The -stop option without an interface specified will stop all captures for all interfaces:
System:/> pcapdump -stopThere is always a separate file created for every interface involved in a capture. Files are saved in volatile memory in the root directory and they are deleted following a restart.
All the available saved output files can now be listed using the -list option:
System:/> pcapdump -list
       PCAP Files

Size  Name
----  ---------------------------
354  if3_2025-11-22_16.32.12.cap
To list the contents of a saved file, use the -show option with the filename:
System:/> pcapdump -show -filename=if3_2025-11-22_16.32.12.cap
Showing packets in file "if3_2025-11-22_16.32.12.cap":
IP 192.168.12.200->192.168.12.1  IHL:20  DataLen:12 TTL:59 Proto:ICMP
ICMP Echo request  ID:4042  Seq:0
-----------------------------------------------------------------------
IP 192.168.12.1->192.168.12.200  IHL:20  DataLen:12 TTL:128 Proto:ICMP
ICMP Echo reply  ID:4042  Seq:0
-----------------------------------------------------------------------
Note that the -show option on its own will just show the packets that are in the buffer memory and have not been written yet. Buffering is discussed further later. If there is a need to stop the output from the show command, the Ctrl-S key sequence can be used to pause output and Ctrl-C can be used to break output.
The -num option can only be used with -show and it limits the number of packets displayed. For example, if only the first 20 packets were to be displayed, the above command would become:
System:/> pcapdump -show -filename=if3_2025-11-22_16.32.12.cap -num=20By default, the -show option displays all packets.
Saved files can be deleted with the -remove option:
System:/> pcapdump -remove -filename=if3_2025-11-22_16.32.12.capWildcards could also have be used when specifying the filename so that a group of matching files can be deleted with one command. For example, to delete all files beginning with "if3":
System:/> pcapdump -remove -filename=if3*This option could be used to remove all stored files with the following command:
System:/> pcapdump -remove -filename=*
All saved files can be deleted and the memory buffer cleared with the following command:
System:/> pcapdump -removeThis buffer is automatically cleared when recording stops if the -nowrite option was not used. If the -nowrite option was used then the -remove option is needed to clear the buffer. A new recording session on the same interface will also clear that interface's buffer.
Using -snaplen to Reduce File Size
The -snaplen option can be used to truncate all packet information before it saved in the buffer and/or a file. However, it will not truncate the information displayed on the console. For example, to only store the first 100 characters of information for each packet, the following command could be used:System:/> pcapdump -start if3 -snaplen=100The -snaplen option is also useful in reducing the space needed in the pcapdump buffer by shortening the packet information stored. The allocated buffer size is discussed later in this section.
The Memory Buffer Records All Packets Stored
Except for the case of using only console output, all packet information captured is always saved in a memory buffer of a fixed size. There is one buffer allocated at the start of a capture for each interface involved. The space in the buffer occupied by packets can vary depending on the type of packets captured. The current buffer contents can be displayed with just the -show option:System:/> pcapdump -showSystem:/> pcapdump -writeSystem:/> pcapdump -write if3 -filename=if3.capSystem:/> pcapdump -start -out -nocapSystem:/> pcapdump -status
PCAP Status
Interface Mode Packets(In) Packets(Out) Filter
--------- ------ ----------- ------------ ------
if3 SNOOP 124 174System:/> pcapdump -removeAs mentioned earlier, the buffer is usually cleared after packet recording stops and files are automatically written. However, if file writing is disabled by using the -nowrite option, the buffer is not cleared and subsequent pcapdump -start commands will append packet information to the current buffer contents.
The administrator has the option to examine the buffer contents or write the buffer contents to file. To clear the buffer when using the -nowrite option, the administrator must use the pcapdump -remove command.
Changing the Allocated Memory Buffer Size
A pcapdump -start command will allocate a buffer for each interface involved in the packet capture. By default, this buffer is 128 Kbytes. If the captured packets exceed this memory allocation, capture will stop and the following message will appear on the console:Packet capture stopped (buffer size limit reached).If this is a problem, the buffer size can be specified as larger in the command to start capture. For example, if the desired buffer size is 256 Kbytes then the command would be the following:
System:/> pcapdump -start if3 -bufsize=256 Writing Directly to the Console
As well as writing output to a file, output can be also directed to the console with the following version of the start command:System:/> pcapdump -start if3 -outSystem:/> pcapdump -start if3 -out -nowriteAs discussed earlier, if the desire was to write to the console but only to the console and not allocate and fill a buffer, the command would be:
System:/> pcapdump -start if3 -out -nocap
Filtering Output
In conjunction with the above versions of the pcapdump command where the -start option was used with an interface, further filters can be applied to further restrict the type of packet captured.The range of filters available is large and is fully documented on the online help (type help pcapdump) as well as in the separate CLI Reference Guide. This section will show examples of some of the filters to illustrate their use.
Port Number
The general use of filters can be illustrated by looking at the filter for a specific port number:
System:/> pcapdump -start if3 -port=53Or on a port range:
System:/> pcapdump -start if3 -port=53-95Alternatively a list of ports could have been specified, so any of the list must match:
System:/> pcapdump -start if3 -port=53,85,92Using -port means either the source or destination port must match the given values. However it is possible to specify these separately:
System:/> pcapdump -start if3 -portdest=45 -portsrc=85cOS Stream provides predefined values which can be used for convenience instead of have to type integers. For example, to filter all traffic using the known FTP port numbers, the command could be:
System:/> pcapdump -start if3 -port=FTP
![[Note]](images/note.png) |
Note: An AND operation is performed on multiple filters |
|---|---|
|
When more than one filter parameter is specified then all parameters must match for the packet to be recorded by pcapdump. In other words, a logical AND operation is performed between the filters. |
Protocol
The -proto parameter looks for a specific traffic protocol at the IP level. For example, to only filter out ICMP traffic:
System:/> pcapdump -start if3 -proto=ICMPEach string value like ICMP that can be used in the CLI is a convenience provided by cOS Stream. The actual assigned protocol number could be used instead. For ICMP, this is the number 1. Lists and ranges of protocols could be specified with either these predefined string values or the actual protocol numbers or both. For example, the following is valid:
System:/> pcapdump -start if3 -proto=ICMP,2,7-9
IP Address
The source or destination IP can be filtered. The IP specified can be IPv4 or IPv6 or a combination of both in a list. Below, is an example which specifies a single IPv4 address:
System:/> pcapdump -start if3 -ip=203.0.113.3A range can be specified instead:
System:/> pcapdump -start if3 -ip=203.0.113.3-203.0.113.7Or an entire network:
System:/> pcapdump -start if3 -ip=203.0.113.0/24Here, IPv4 is mixed with IPv6:
System:/> pcapdump -start if3 -ip=203.0.113.3,2001:db8::1Using -ip on its own means either the source or destination IPs must match the filter. However, these can be separated:
System:/> pcapdump -start if3 -ipsrc=203.0.113.3 -ipdest=2001:db8::1
![[Caution]](images/caution.png) |
Caution: Pcapdump can degrade performance |
|---|---|
|
Running pcapdump will have some impact on overall system performance. The degree of impact depends on the options chosen. The impact can be reduced by capturing on the smallest number of interfaces possible and through using filters to reduce the amount of packets captured. Raising the values of the -bufsize and/or -count options too high can have a particularly adverse effect on performance. |
The administrator must use SCP in order to download the .cap files created by pcapdump from cOS Stream disk storage to a local management workstation for reading by Wireshark.
Writing in Hex and K12 Format
All files written by the pcapdump command are in the .cap format. However, it is possible to write console output in either hexadecimal or K12 format. For example, to write output to the console in hexadecimal format, the command would be:System:/> pcapdump -start if3 -out -hexSystem:/> pcapdump -start if3 -out -k12cOS Stream can also perform a conversion from the current buffer contents in .cap format to hexadecimal or K12 format on the console. To display the current buffer contents in hexadecimal, the command would be:
System:/> pcapdump -show if3 -hex
Writing hexadecimal to the console provides an alternative way to get packet data into Wireshark or another tool. The hexadecimal output displayed in an SSH client console can be copy and pasted into a local text file on the management workstation and then that file can be read by Wireshark.
The PCAP Remote Capture feature enables network administrators to perform packet captures towards cOS Stream remotely using a third party software such as Wireshark or TShark over an SSH connection. This feature is designed to facilitate detailed network traffic analysis without the need to save captured data to a local, potentially limited, buffer.
When Remote Capture is enabled, administrators can initiate a packet capture session from their local machine, connecting securely to a cOS Stream firewall through SSH. The firewall acts as the capture source, providing real-time packet data to the connected e.g. Wireshark instance. This allows for in-depth inspection of network traffic traversing cOS Stream, including troubleshooting, security analysis, and performance monitoring.
Allowing Remote Capture In cOS Stream
Allowing Remote Capture does not require any additional configuration other than SSH management access to the firewall, which should be already configured on at least one interface. It can be the same interface and management rule the administrator already use to manage the firewall. The following CLI command can be used to see a summary of the current SSH remote management access rule(s).System:/> show RemoteManagement |
Note: Session Timeout For Long-term Captures |
|---|---|
|
Depending on the amount of captured packets and the duration, the SSH setting "SessionIdleTime" may have to be modified in order to avoid the SSH connection timing out. Active packet captures does not count as being active in the SSH session. |
![[Warning]](images/warning.png) |
Warning: Remote Capturing On A Problematic Interface |
|---|---|
|
Remote Capture can be very useful in gathering raw data from a cOS Stream firewall, but if the interface being troubleshooted is the same interface that is being connected to for the remote capture, critical details may be lost. An example would be if troubleshooting a packet loss problem and the packet that the administrator wanted to see got lost due to the packet loss issue. This would not be caught in the remote capture data and generates a potential catch-22 situation. For such situations/scenarios it is recommended to perform a pcap capture locally on the firewall using the CLI or connect with SSH for remote capture towards an interface that is not being troubleshooted. |
|
Warning: Remote Capture of the SSH Capture Data |
|---|---|
|
Capturing packets on the same interface that the Remote Capture uses, with a wide enough filter which also captures the SSH capture data, will create a loop. Potentially DOS'ing the capture user. |
Filtering Support
Only the basic form of inclusion filtering is supported. This means that it is not possible to use keywords such as "not", "or" or parentheses ( ). It is possible to select ranges (when applicable) and groups up to four. Attempts to use an unsupported filter would result in an error message regarding unsupported filter parsing.Supported IP protocol presets:
TCP / UDP / ICMP / ICMPv6 / IGMP / IPv4 / IPv6 / GRE
/ ESP / AH / MTP / SCTP / OSPF / L2TP / ip proto <n>
IP filtering keywords:
src host / src net / dst host / dst net / host / net
Ethernet filtering keywords:
ether src / ether dst / ether host
Port filtering keywords:
src port / src portrange / dst port / dst portrange
/ port / portrange
Filter Examples:
Filter UDP traffic from/to port 53:udp port 53Filter OSPF traffic from 192.168.0.1 and 192.168.0.10:
ospf src host 192.168.0.1,192.168.0.10Filter TCP traffic to 192.168.0.0/16:
tcp dst net 192.168.0.0/16Filter traffic from/to ports 5000-6000 and 8000-10000:
portrange 5000-6000,8000-10000Filter traffic from/to ethernet address 00:11:22:33:44:55:
ether host 00:11:22:33:44:55Filter traffic with IP protocol 100 (GMTP):
ip proto 100Filter ICMP traffic coming from host 192.168.0.1 going to 192.168.0.2:
icmp and src host 192.168.0.1 and dst host 192.168.0.2
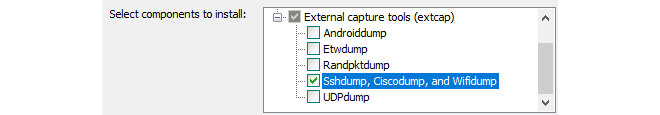
Wireshark Support
Using Remote Capture in Wireshark is possible but the needed external capture tool (SSHDump) is not installed by default and must be selected during software installation as shown below: Configuring Remote Capture in Wireshark consists of the following steps (example) once SSHDump is installed:Open the configuration properties for SSH remote capture
Under the Server tab, input the IP address and port (if not default 22) to the firewall. E.g. 192.168.98.16 and port 22
Under the Authentication tab, input the username and password to the firewall
|
Warning: Administrator Permissions Are Required in cOS Stream |
|---|---|
|
In order for Wireshark to perform remote captures, sufficient permissions are needed for the user. A user with Auditor permissions is not allowed to perform PCAP operations towards the firewall. |
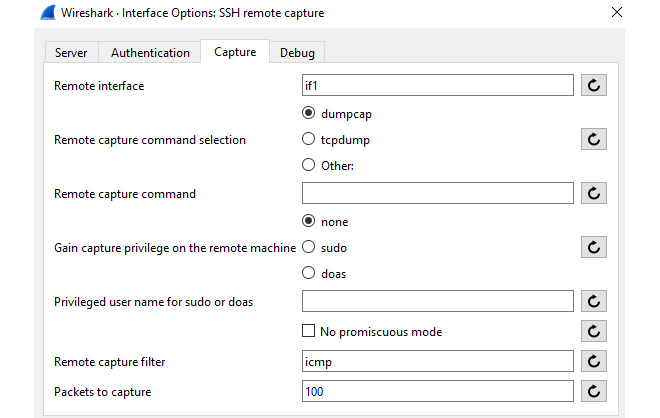
Under the Capture tab:
Type in the name of the interface (on the firewall) to capture packets from (e.g. if1)
Select dumpcap for the Remote Capture Command Selection option.
Select none for the Gain capture privilege on the remote machine option.
Clear the pre-defined filter in the Remote capture filter field and replace it with the desired a filter, e.g. "icmp" as shown in the below picture.
The default filter (trying to exclude the SSH management traffic) is using a filter syntax that is not supported and will not work.
|
Note: Using Filter Is Required in Wireshark |
|---|---|
|
Using a filter directly on the capture interface is required when using Wireshark in order to filter the packet captured on the firewall first before they are sent over SSH to Wireshark. Leaving the filter field blank is not supported and will generate an error when attempting to connect to the firewall for Remote Capture. |
dumpcap -i <iface> -w - -s <snaplen> -f '<filter>'Remember to change the Remote Capture Command Selection option from "dumpcap" to "Other" in order to use manual options and filters.
Using Remote Capture Command To Limit Capture Size (Snaplen)
Using the Remote Capture Command field to manually input a capture syntax can have a big advantage as it is possible to use the "-s" flag which means snaplength, a way to limit the amount of data captured in each packet.This can have be very useful as it is then possible to limit the amount of data captured in each packet. If the administrator is only interested in the headers of the packets and not actual data/payloads there would be no point of capturing large amounts of data which can be very bandwidth intensive. By setting the "-s" parameter to e.g. 100 it means that it only captures the 100 first bytes of the packet, which can be very useful to keep the bandwidth low while at the same time being able to capture large amounts of packets.
An example syntax when snaplength is set to 100 bytes;
dumpcap -i if1 -w - -s 100 -f icmp
Remember to change the Remote Capture Command Selection option from "dumpcap" to "Other" in order to use manual options and filters.
TShark Support
TShark is a command-line network protocol analyzer, similar to Wireshark, that captures and analyzes network traffic. It provides detailed packet data, either in real-time or from pre-captured files, in a text-based format suitable for automation and scripting.To capture packets using TShark, the following command template can be used:
ssh admin@<ip> "dumpcap -i <iface> -w - -f '<filter>'" | tshark -i -
Replacing <ip> with the IP of the firewall, <iface> with the interface to capture on and <filter> with the capture filter.
|
Note: Public Key Requirement |
|---|---|
|
For capture to work using TShark, SSH login must be performed using "passwordless" public key. |
The techsupport CLI command is a general command for problem troubleshooting that combines the output from several other troubleshooting commands into a single console output. This information can then used by the administrator but is usually sent to qualified support personnel to troubleshoot problems.
The simplest form of the command is the following:
System:/> techsupportThis will create a file in the top level (root) directory of the system file system called techsupport.txt. Each usage of the command will overwrite any previous techsupport.txt file.
Once created, there are two ways of examining the file's contents:
Download the file over a network connection by using SCP from an external management computer.
Use the following CLI command to display the current file contents on the console:
System:/> techsupport -showThe output on the console will automatically be paginated with an interactive prompt to show the next page. To display the entire file at once without pagination, use the following command:
System:/> techsupport -show -nopages
The first few lines of the techsupport.text file include the system time when the contents were created. A typical example of this header is the following:
Technical Support Information
Please verify the contents before sending to Technical Support.
System Time: 2025-11-22 12:13:48 (UTC+00:00)